Category Dreams of Other Worlds

A World by Any Other Name

Comets and asteroids provide evidence of the formation epoch of our Solar System. They represent the pristine stardust of which we are made. They’re implicated in life and death in the evolution of life on Earth. But they’re minor bodies of the Solar System. The three targets of Stardust’s study are a motley, misshapen collec­tion. There’s 5535 Annefrank, three miles across and shaped like a right-angled prism. There’s Wild 2, similar in size, with a pitted and coruscated surface. And there’s 9P/Tempel, slightly larger and shaped like a potato. Are they big enough to be called worlds? Are they substantial enough to have a place in our dreams?

Yes, absolutely. They may be too small to hold an atmosphere, but comets and asteroids have unique shapes and topographies that imbue them with personality. Our technology is good enough to throw a gravity “lasso” around a space rock that ventures near us and steer it into Earth orbit. Comets contain water ice and organic material needed to sustain life, and the hydrogen and oxygen in the water are all that’s needed to make rocket fuel. A comet retained in high Earth orbit would be a perfect jumping-off point for manned exploration of the outer Solar System and beyond. Asteroids also contain valuable metals and minerals; according to one estimate, the mineral wealth in the asteroid belt amounts to $100 billion for every person on Earth.52 Wild 2 probably contains around $20 trillion worth of precious and industrial metals, and over $100 bil­lion worth of platinum alone.53 In fact, the precious metals we do have were gifts from comets in the early days of the Solar System. Metals present when the Earth formed settled directly to the core while the planet was molten; those we can reach in the crust were “dusted” onto the planet by later waves of comets.54

Space mining aside, a small, barren rock might not be worth calling your own. The 1967 United Nations Outer Space Treaty prohibits any State owning or controlling the Moon, an asteroid, or a comet, but the treaty has a loophole since it doesn’t specifi­cally exclude the ownership rights of an individual.55 A small world might seem limiting, but think of the pleasure in owning a world the size of a small town and surveying the domain like a colossus. The gravity of Wild 2 is so weak you would literally be as light as a feather. A small push and you could escape your world and sail into deep space. And think of the glittering minerals—a hoard magnificent enough to power all the dreams ever dreamed.

Stepping Out into the Universe

It sounds implausible that a small telescope with a single mode of observing could touch every area of astrophysics from planets to cosmology, but that’s the legacy of Hipparcos. By measuring the positions of more than 100,000 stars two hundred times more ac­curately than ever before, Hipparcos redefined and recalibrated the basic ingredients of stars, and that’s fundamental because stel­lar properties lie at the base of a pyramid of methods used to es­tablish the distance to nearby galaxies and on into the universe.41 Without a tether in nearby stars, the entire edifice of the cosmo­logical interpretation of redshift, where the shift of galaxy radia­tion to longer wavelength is used to ascribe a distance according to cosmic expansion, would be suspect.

In the Solar System, distances to the planets are known with very high precision. We can bounce radar off Mercury, Venus, and Mars, and measure the time of its round-trip journey to derive distance. Kepler’s laws provide the relationship between orbit pe­riod and distance that lets us calculate the distance to the outer planets. Beyond the Solar System, even the nearest star is trillions of miles away. The most direct method of measuring distance uses the slightly different perspectives on a nearby star between when the Earth is six months apart in its orbit of the Sun. As we’ve seen, this is stellar parallax. A skinny triangle in space is created with the base equal to the Earth’s orbital diameter and the long sides hun­dreds of thousands of times longer. Distances measured by trigo­nometry involve no assumptions (except that three-dimensional space is flat and Euclidean) so they form the secure base for all other distance determinations in the universe.42

As astronomers step out through the universe, no single method of measuring distance works on all scales. So they have to step out with a series of overlapping indicators, each of which has a range of applicability. Like a series of ladders climbing high into the sky, where a wobbly lower ladder causes the whole edifice to sway, a tighter local distance scale ensures more accurate distances to galaxies. Before Hipparcos, astronomers had measured the dis­tances to several dozen stars with just 1 percent precision. Hip – parcos increased that haul by more than an order of magnitude to more than four hundred stars. At the precision level of 5 percent, Hipparcos increased the number of stars with reliable triangulated distance from one hundred to over seven thousand. Good distance determinations are now widely available out to nearly five hun­dred light-years from the Sun. That’s a small patch of the Milky Way, which is 100,000 light-years across, but it’s a patch large enough to include all stellar types and almost all known exoplan­ets. The precision of the distances maps into a similar precision for the derived parameters such as size, luminosity, and mass.

Hipparcos measured the distance of the bright star Polaris as 432 light-years and tightened the error from thirty to seven light- years. Polaris is important for the distance scale because it’s the closest and brightest Cepheid variable star, whose properties define a distance indicator that can be used from our neighborhood in the Milky Way out to galaxies tens of millions of light-years away. Un­fortunately, Polaris turns out to be anomalous and a recent study revised the Hipparcos distance down by a third to 323 light-years.43 Another bright star, Deneb, had an estimated distance of 3,200 light-years that was almost completely indeterminate; its distance firmed up to 1,400 light-years with an error of 230 light-years. Hipparcos also measured distances to a few open star clusters like the Pleiades and the Hyades, which allows bridges to be built to more remote regions of space.44 First, the trend line of main se­quence stars—a relationship between luminosity and temperature when the energy source is hydrogen fusion—can be fit for all stars within the cluster. The offset between the main sequence best fits for two clusters gives the relative distance because the brightness of the stars goes down with the square of the increasing distance. Second, a cluster will contain rare variable stars like Cepheids and RR Lyraes that can be seen to very large distances (Polaris is a nearby Cepheid variable). Cepheids have a useful linear relation­ship between their luminosity and the period of their variability, so knowing the period and the relative brightness of two Cepheids gives the relative distance between them.45

Nearby variable stars with parallax measurements can be used to reach out to analogous variables in galaxies as far away as the Virgo Cluster, 54 million light-years away. Once in the realm of galaxies, global properties of galaxies such as their rotation rates and sizes are used to calculate relative distances. By now, the lad­der is getting rickety and errors are 10 percent or more. Thereafter, the expansion of the universe imprints a redshift on all galaxies, and distances can be derived in the context of the big bang model, which relates distance to recession velocity for all galaxies. Ex­ploding stars called supernovae are also used to estimate distances in the remote universe, billions of light-years from the Earth, but all these methods are rooted in the work of the modest Hipparcos telescope.

NASA and Earth Observation

“When you cut your teeth on other worlds,” Carl Sagan once noted, “you gain a perspective about the fragility of planetary envi­ronments and about what other, quite different, environments are possible.”71 Sagan points to James Hansen’s research of Venus that led to early climate models to predict how greenhouse gases had been trapped in its atmosphere and might similarly impact Earth’s climate, as well as Mario Molina and Sherwood Rowland’s inves­tigation of chlorine and fluorine molecules in Venus’s atmosphere that led to an understanding of the threat of CFCs to Earth’s ozone layer. These investigations of Venus revealed that Earth’s dynamic biosphere could lose its ability to support life.

Lovelock has expressed his concern not so much that our car­bon footprint will destroy the Earth, but that warming of Earth’s atmosphere could mean the end of our civilization as we know it. Suggesting we make plans for “sustainable retreat,” Lovelock at the age of eighty-nine comments, “It’s really a question of. . . where we will get our food, water. How we will generate energy.”72 This is not a new position for Lovelock. Even from the beginning stages of Gaia Theory, Steven Dick and James Strick comment, “He realized that the gases that living organisms most actively af­fect, especially carbon dioxide, methane, oxygen and water vapor, are just those gases that most dramatically shape the climate of a planet.”73 “I can only guess the details of the warm spell due,” wrote Lovelock in 1988. “Will Boston, London, Venice, and the Netherlands vanish beneath the sea? Will the Sahara extend to cross the equator?”74 He’s not being facetious.

In The Ice Chronicles, scientist Paul Mayewski and science writer Frank White discuss the findings from the Greenland Ice Sheet Project 2’s (GISP2) ice cores drilled in central Greenland in 1990. The cores capture a 100,000-year record of the chemi­cal composition of Earth’s atmosphere and a picture of the rate of thinning of Greenland’s glaciers. Of the book, Lynn Margulis noted, “The story of how international science obtained this fund of Pleistocene data from the central Greenland ice sheet reads like a novel.”75 However, this text isn’t some action-adventure tale of humans against nature, but a serious assessment of changes in at­mospheric composition over long time scales. Captured deep in the Greenland ice are tiny air bubbles that serve as time capsules from thousands of years ago. Scientists can analyze the air in the bubbles to determine the composition of Earth’s atmosphere in ages past. Mayewski and White assert unequivocally that increases in methane and carbon dioxide produced through industry, agri­culture, and mass transport are dramatically warming our planet’s atmosphere. They write: “As with CO2, methane is increasing at a rate that has never before been seen, and, as with CO2, the in­crease correlates strongly with rising temperatures. . . . The result is that we are having a profound impact on the climate system.” Mayewski and White note that the ice core data indicate that eco­systems on a global scale can be “easily and quickly disturbed.”76 Climatologists are concerned that global warming could cause the collapse of the world’s ice sheets, which in turn would produce an unprecedented rise in sea level. In 2011, British glaciologist Alun Hubbard reported that an expanse of glacial ice estimated at twice the size of Manhattan was on the brink of breaking free from Greenland. The previous year a stretch of ice four times the size of Manhattan, spanning 112 square miles, broke off the Greenland Ice Sheet and was adrift at sea in large chunks. “The freshwater stored in this ice island could keep the Delaware or Hudson rivers flowing for more than two years,” estimated Andreas Muenchow at the University of Delaware. “It could also keep all U. S. public tap water flowing for 120 days.”77 Though Muenchow emphasizes that ocean scientists, glaciologists, and climatologists cannot yet predict the effects of melting glacial ice, he is nevertheless con­cerned, and he’s not alone. The 2001 Amsterdam Declaration on Global Change reads:

Global change cannot be understood in terms of a simple cause – effect paradigm. Human-driven changes cause multiple effects that cascade through the Earth System in complex ways. These effects interact with each other and with local – and regional-scale changes in multidimensional patterns that are difficult to understand and even more difficult to predict. . . . In terms of some key environmental pa­rameters, the Earth System has moved well outside the range of the natural variability exhibited over the last half million years at least. The nature of changes now occurring simultaneously in the Earth System, their magnitudes and rates of change are unprecedented. The Earth is currently operating in a no-analogue state.78

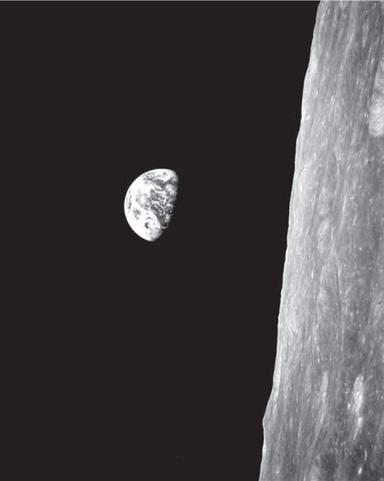
It’s no coincidence that Gaia Theory emerged in the late 1960s and early 1970s at the height of the Space Age, precisely as space travel and satellite observation began offering consistent and detailed global views of Earth (figure 2.5). NASA’s Landsat 1, launched in 1972, was the first satellite dedicated solely to Earth observation, particularly of landmasses.79 Nor is it surprising that

NASA and Earth Observation

Figure 2.5. Earthrise in the orientation from which the Apollo 8 crew saw it from lunar orbit. In zero gravity, the normal senses of up, down, and the horizon have no particular meaning. Just two dozen astronauts have ever experienced the extraordinary sight of their home planet rising over the horizon of another world (NASA/Apollo 8).

the original cover of Lovelock’s book Gaia: A New Look at Life on Earth (1979) was illustrated with Apollo 17’s Whole Earth photo­graph, considered among photo historians as the most reproduced image in history. While “Gaia theory forces a planetary perspec­tive,” as Lovelock points out, that invaluable perspective was only possible with a serious commitment to space exploration. “It took the view of the Earth from space,” writes Lovelock, “either directly through the eyes of an astronaut, or vicariously through visual media, to let us sense a planet on which living things, the air, the oceans, and rocks all combine in one as Gaia.”80

By 1983, NASA had established the Earth System Sciences Com­mittee (ESSC) to publish recommendations for a concerted science program in global Earth studies and satellite observing programs. NASA’s planetary science and recent Earth observing missions have offered scientists their best understanding yet of the complex and interconnected Earth systems that sustain our biosphere. Several missions are specifically focused on understanding and mitigating, if possible, the effects of industrialized human activity.

NASA’s GOES satellites offer real-time data regarding Earth’s weather systems. The Aqua mission measures all aspects of Earth’s water cycle in the solid, liquid, and gas states as well as global water temperatures, vegetation cover, and phytoplankton, which construct their shells from carbon dioxide and deposit that carbon onto the seafloor when they expire. The joint NASA and Argentin­ian Aquarius mission catalogs the salinity of Earth’s oceans, while NASA’s Aura mission monitors changes to Earth’s ozone layer. In collaboration with the German Aerospace Center, NASA supports the GRACE mission, which has observed a large drawdown of fresh water globally, from Northern Africa to the large agricultural San Joaquin valley in California.81 NASA and the French Space Agency together support the CALIPSO mission to track airborne particles or aerosols to determine their impact on global climate. These are only a handful of the varied and complex missions NASA supports in observing Earth’s biological, hydrological, and geochemical sys­tems. What we have learned from missions like these not only helps us to better understand climate change and its impact on life on Earth but also has prepared us to search for life on moons in the outer solar system and on exoplanets orbiting nearby stars. When telescopic detectors become sensitive enough, astrobiologists will scour the spectra of exoplanets light-years away searching for the biomarkers of oxygen or ozone, as these gases have no other sig­nificant source on Earth than its living organisms.

In 2006, on the thirtieth anniversary of the Viking Mission, Joel Levine, principal investigator of the proposed Mars Ares mission to fly a robotic plane over Mars to search for evidence of life, noted that scholars are still researching Viking’s nearly 60,000 im­ages, which remain “one of the most exciting, one of the most productive data sets we have ever obtained.”82 Venus and Mars, the closest worlds to Earth, retain their allure and mystery. Venus is a near twin of the Earth, our true sister planet, yet a runaway greenhouse effect has heated it to the point where life isn’t pos­sible. It’s a salutary reminder of what might happen if we don’t get our house in order in terms of carbon emissions. We wince and turn away. Mars, meanwhile, is the lightweight cousin of the Earth. In 2009, scientists at the India Space Research Organization (ISRO) reported having discovered thriving in Earth’s stratosphere three previously unidentified species of bacteria, despite consistent exposure to ultraviolet radiation that usually kills such organisms. Given that conditions in the Earth’s stratosphere closely resemble the atmosphere on Mars, the finding profoundly recalls Viking’s controversial experiments conducted on Martian soil decades ago. If there is biology on Mars, it leads a tenuous existence in hospi­table pockets below the surface. Until we definitively discover life, either on Mars or elsewhere, we invest these worlds with our full imagination, and project onto them our hopes, fears, and longings, anticipating the time when our isolation ends and we find compan­ionship in the cosmos—if only in a colony of microbes.

The Tireless Twins

Here are the basics of these twin long-distance explorers. The Voy­agers are nearly identical spacecraft, each weighing about 800 ki­lograms, the same as a very small car. The heart of each spacecraft is a ten-sided polygon which contains the electronics and which shelters a spherical tank holding the hydrazine fuel. The polygon is fronted by a ten-foot diameter high-gain antenna, which has kept communicating with the home planet even as it receded to a tiny

The Tireless Twins

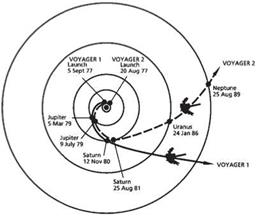
Figure 4.1. The twin Voyagers used gravitational assist to exceed the Sun’s escape velocity and leave the Solar System. Despite its later launch, Voyager 1 reached Jupiter four months ahead of Voyager 2 due to a more direct path. Both spacecraft rendezvoused with Saturn, but only Voyager 2 had an encounter with Uranus and Neptune (NASA/Jet Propulsion Laboratory).

dot billions of miles away. Attached to one side of the polygon is a gold long-playing record; this apparent incongruity will be dis­cussed later. Voyager’s ten scientific instruments are attached to a couple of booms that extend away from the central polygon. The instruments include cameras and spectrometers, and there are de­vices for measuring magnetic fields, charged particles, cosmic rays, and radio waves. The video camera is based on a design devel­oped by RCA in the 1950s. That seems hopelessly archaic, yet the Voyager vidicons were very robust and they worked flawlessly.10 The mission cost $865 million through the Neptune encounter, and has been continuing on a dribble of funds as the spacecraft head beyond the Solar System. That works out to 5 cents per mile, cheaper than running a fuel-efficient car like a Toyota Prius. Ac­tual fuel efficiency is even better. Each launch vehicle had 700 tons of fuel; so far the Voyagers are getting about 80,000 miles per gallon!

Solar power is inadequate in the outer Solar System; too little radiation would reach the spacecraft. Voyager used an onboard power system called a Radioisotope Thermoelectric Generator, or RTG. Three of these were attached to a boom coming off the spacecraft. RTG’s had been used by the Vikings and the Pioneers previously, and subsequently they’ve been used by the Galileo, Ulysses, Cassini, and New Horizons spacecraft. Each RTG uses a fist-sized radiation source containing plutonium oxide to gener­ate heat, which is continuously converted into electrical current.11 Plutonum-238 (which is distinct from the Plutonium-239 that’s used in nuclear weapons) decays with a half-life of eighty-eight years. The Voyagers were getting 470 Watts of power at launch, but now they’re down to 250 Watts. That gentle decline in power is an inevitable consequence of nuclear physics, and as power has diminished, instruments have been switched off. In a few years, the gyroscopes will be shut down, and in the mid-2020s the Voyagers will go silent.

These are remarkable little spacecraft. Even though they are long in the tooth and obsolete by modern standards, they continue to generate scientific discoveries after thirty-five years. Think of it—they communicate at 160 bits per second, or a lower informa­tion rate than spoken speech and 25,000 times slower than “basic broadband” Internet service; they do their work with less than three light bulbs’ worth of power; and they’ve barely used half of their 220 pounds of hydrazine fuel after traveling 10 billion miles! On the Earth, 8-track tape decks and LP records have been relegated to yard sales; at the edge of the Solar System they’re still cutting edge. Moreover, the Voyagers are not too old to learn “new media” tricks. They have 25,000 followers on Twitter between them, with Voyager 2 being the more garrulous of the pair.

Ed Stone is the “father” of these middle-aged twins. Stone has had a storied career, serving as director of the Jet Propulsion Lab and chair of the Division of Physics, Mathematics and Astronomy at Caltech. He’s a Fellow of the National Academy of Sciences and winner of the President’s National Medal of Science and NASA’s Distinguished Service Medal. He also has asteroid 5841 named after him. Stone has been principal investigator for nine NASA missions, but the Voyagers hold a special place in his affections. He started working on the project in 1972; he’s now seventy-six, and he has no intention of retiring or slowing down. He intends to follow their progress all the way into the depths of interstellar space. In a 2011 interview, he allowed himself some introspection: “What a journey, what a thrill. . . . We were finding things we never imagined, gaining a clearer understanding of the environment the Earth was a part of. I can close my eyes and still remember every part of it.”12

Tools of the Swiss Army Knife

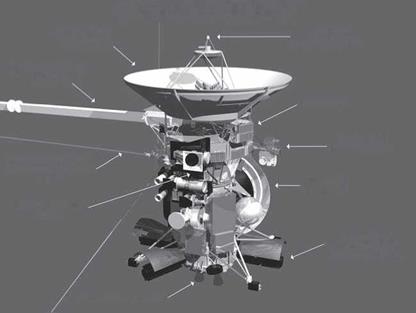
The Cassini orbiter has twelve scientific instruments and the Huy­gens probe had six. Tools on this “Swiss army knife” fall into three categories: remote sensing using visible light, remote sensing using microwaves, and studies of the environment near the spacecraft (figure 5.4). Despite using 13,000 electronic components and 10 miles of cable, each of the instruments has worked as planned. Many scientific studies use data from more than one instrument. The optical remote sensing instruments are all mounted on a pal­ette so that they face the same way. The main camera on Cassini is the Imaging Science Subsystem and it has been most people’s en­tree into the exotic world of Saturn and its moons. Carolyn Porco, the principal investigator of the instrument team, maintains a web­site loaded with amazing images and evocative descriptions.27 As noted earlier, she uses a Captain’s Log motif with affectionate al­lusions to Star Trek, and its clear she’s having the time of her life as Cassini images new worlds with unprecedented levels of detail. She’s compared a leadership role in a big space mission with child rearing—a journey of thrills and heartache, excitement and oc­casional disappointments, lasting twenty years or more. Even the most jaded cynic about big science would be entranced by the best pictures from the main imager.

Two mapping spectrometers look at the properties of Saturn, its moons, and its rings at optical and infrared wavelengths. This is the key to determining their composition and temperature. An ul­traviolet spectrometer does the same thing at shorter wavelengths than the eye can see, as another guide to chemical composition. Cassini can’t capture samples of the atmospheres or rings, so re­mote sensing with spectrometers is the best guide to chemistry. The

Tools of the Swiss Army KnifeCASSINI SPACECRAFT

Подпись:

Tools of the Swiss Army Knife Tools of the Swiss Army Knife

Low-Gain
Antenna (1 of 2)

445 N Engine (1 of 2) –

Figure 5.4. Cassini is a large and complex spacecraft about the size of a bus, with twelve scientific instruments, plus six on the Huygens lander. The instruments include cameras and spectrometers and others to measure magnetic fields, high energy particles, radio waves, microwaves. The power source is radioactive plutonium (NASA/Jet Propulsion Laboratory).

spacecraft’s microwave remote sensing instruments function a bit differently. Optical remote sensing just uses available light or radi­ation reflected from the planet, moon, or ring particle. Cassini has to generate its own radio waves and microwaves, send them to the target with a 4-meter high gain antenna at one end of the space­craft, then “listen” for a weak echo signal. The radar instrument can penetrate Titan’s atmosphere and so make topographic and compositional maps. It can also see deeper into the atmosphere of Saturn than any other instrument. The radio instrument looks for fine structure. It also makes Doppler measurements that allow the masses of Jupiter’s moons to be precisely calculated.28

A set of onboard instruments measure energetic particles, ions, and magnetic field strengths at the position of the spacecraft at any time. Here the complex orbital gymnastics are essential; to make a map of these properties the onboard instruments need to sample data from as many locations within the system as possible.

Several of the six instruments are devoted to understanding Sat­urn’s magnetic field via the charged particles that it often accel­erates. To avoid overspecialization, NASA selected six teams of interdisciplinary scientists. Their job is to use Cassini’s instruments in concert to maximize the learning and perhaps answer questions that hadn’t been anticipated. All this instrumentation is power – hungry and like other probes to the outer Solar System, there isn’t enough sunlight for solar panels, so Cassini uses 72 pounds of Plutonium.

LIVING WITH A RESTLESS STAR

Imagine you woke up one morning and your planet had been engulfed by the atmosphere of a star. High-energy particles slam into the atmo­sphere, creating shimmering auroras. Sunspots flicker, each one re­leasing more energy than the largest atomic bomb. Great loops of hot gas uncoil from the star’s surface, extending millions of miles. Each whip crack of activity causes mayhem on orbiting satellites, frying their circuit boards and wreaking havoc on their guidance systems. Your planet is assailed by high-energy particles traveling at nearly the speed of light. Looking at the star, its emission doesn’t change detectably from day to day or year to year, but its invisible short wavelength radiation fluctuates wildly and unpredictably.

Where is this place? It’s the Earth, and the star is the Sun. This activity isn’t because the Sun has run out of nuclear fuel and has turned into a red giant; our star is in the dull middle age of its life. But the clean, crisp edge the Sun seems to have in the daytime sky is an illusion. That curved surface—the edge of the photosphere— corresponds to a place where the gas of the Sun has thinned out to the point where photons no longer careen into particles and they can travel freely.1 From that point they travel in straight lines with­out interruption, streaking to the Earth in eight minutes. Inside the photosphere, which is a slender sheath thinner than the skin on an apple compared to its radius, the Sun is opaque and our view is blocked. We see the boundary layer as having a sharp edge, just like a cloud has a well-defined edge.2

The edge is an illusion because there’s no physical surface or barrier. If you could penetrate the Sun in a spaceship, you’d feel no bump. The material of the Sun extends much further into space than its visible edge. In its physical quantities of temperature, pres­sure, and density, the Sun varies continuously and smoothly from its fusion core outward. It possesses a surprising multi-million – degree corona, the influence of which extends past the Earth’s orbit almost to the edge of the Solar System. Invisible forms of high-energy radiation and subatomic particles—ultraviolet waves, X-rays, gamma rays, and relativistic cosmic rays—streak toward us and past us at the speed of light. In a very real sense, we live “inside” the atmosphere of an active star, with profound and sur­prising consequences for life on Earth.

Hipparcos Touches All of Astronomy

Astrometry may be the “Cinderella” of modern astronomy, but astronomers in all fields are continually reminded that everything starts with mapping brightness and position. Hipparcos leveraged historical measurements by providing the most accurate reference frame.46 With the invention of the photographic plate in the mid­nineteenth century, comparing photographs of star positions from different eras could in principle reveal star motions, but it’s usually unclear which set of plates has the largest errors. With Hipparcos as the rock-steady “gold standard,” astronomers gleaned new in­sights from century-old data.

The hundred or more observations that the satellite made of each star allowed it to detect variability. Over 12,000 variable stars were found in the database, about 10 percent of all the stars studied, two-thirds of which were previously unknown.47 The observation of the variables was coordinated with a network of amateur astronomers, who filled in with data when a star was tem­porarily out of the satellite’s viewing zone. Hipparcos was also able to resolve or distinguish over 24,000 double and multiple star systems.48 Binary stars were actually a headache for the science team, because they mimicked problems in the photometry and a faint companion could throw off the position of the brighter star in a pair if the two images were not well separated.

A sampling of projects will give a sense of the dizzying range of investigations enabled by the Hipparcos data. Galactic archaeol­ogy is a good example. Hipparcos data showed that some of the stars in the neighborhood of the Sun are part of a disk that’s ten times thicker than the disk where most of the Milky Way’s star formation takes place.49 Differences in the heavy element abun­dance in the two components are consistent with a model where the Milky Way was assembled from smaller galaxies over billions of years.50 Ten percent of the stars in the spherical halo as well as some in the “thick” disk seem to come from a single “invader” gal­axy that was disrupted soon after the Milky Way formed. Also, the fine view of stellar motions provided by Hipparcos allows astrono­mers to turn back the clock and trace the Sun’s passage around the galaxy and in and out of the galactic disk over the past 500 million years. During that time the Sun has passed through spiral arms four times, each corresponding to an extended cold spell in the climate history of the Earth. It is speculated that exposure to high cosmic ray flux in the spiral arms leads to more cloud cover and longer Ice Ages.51

Hipparcos data were used to show that the dim companions in some stellar systems are brown dwarfs. These elusive objects are gas balls less than 8 percent of the mass of the Sun; too cool to shine by nuclear fusion, they emit a feeble infrared glow and slowly contract as they leak their energy into space. In 1991, a star being observed by Hipparcos dimmed slightly on five occasions due to the shadow of a giant planet passing in front of it. This was four years before Mayor and Quleoz stunned the world with their discovery of the first planet beyond the Solar System. But nobody was looking for such signals in the Hipparcos data, so the eclipses remained undetected until 1999.52 Since then additional exoplan­ets have been dug out of the database.

Hipparcos also produced a beautiful confirmation of general relativity (we earlier described a test of relativity by Cassini). Ein­stein’s theory states that mass bends light, and it was first con­firmed in 1919 by observations of the deflection of starlight as it grazed the limb of the Sun while observed during an eclipse. Gen­eral relativistic bending is 1.7 arc seconds at the limb of the Sun, and it declines with the projected distance from the Sun’s gravity but is still a detectable 0.004 arc seconds at right angles to the sight line toward the Sun.53 This subtle measurement shows that the paradigm of curved space applies everywhere. The curvature is so slight that it doesn’t negate the use of Euclidean triangles to measure distances. To test general relativity, while firming up mea­surements of the size and expansion rate of the universe, is quite an achievement for a small and often-overlooked space mission.

THE LITTLE ROVERS THAT COULD

The essay is short and very simple; the words are almost heartbreaking: “I used to live in an orphanage. It was dark and cold and lonely. At night, I looked up at the sparkly sky and felt better. I dreamed I could fly there. In America, I can make all my dreams come true. . . . Thank you for the Spirit and the Opportunity.”1 Sofi Collis was abandoned at birth into a Siberian orphanage and brought by her adoptive parents to live in Scottsdale, Arizona. In 2003, at age nine, she was writing in response to a call from NASA for names for its upcoming Mars rovers. A team of judges selected by the Lego Company and the nonprofit Planetary Society painstakingly whit­tled 10,000 entries down to thirty-three, and NASA made the final selection. Sofi unveiled the names at a pre-launch press conference hosted by Sean O’Keefe, NASA’s administrator, who noted that her story twinned the two original spacefaring countries. It’s safe to say her dreams are as boundless as space itself.

Six years later, in language that was formal, cumbersome, and numbingly prosaic relative to the lofty sentiment it conveyed, the U. S. House of Representatives gave a formal nod to these remark­able robotic emissaries with the following resolution, number 67 from the first session of the 111th session of Congress, adopted unanimously:

Whereas the Mars Exploration Rovers Spirit and Opportunity suc­cessfully landed on Mars on January 3, 2004, and January 24, 2004, respectively, on missions to search for evidence indicating that Mars

once held conditions hospitable to life; whereas NASA’s Jet Propul­sion Laboratory (JPL), managed by the California Institute of Technol­ogy (Caltech), designed and built the Rovers, Spirit and Opportunity; whereas Cornell University led the development of advanced scien­tific instruments carried by the 2 Rovers, and continues to play a leading role in the operation of the 2 Rovers and the processing and analysis of the images and other data sent back to Earth; whereas the Rovers relayed over a quarter million images taken from the surface of Mars; whereas studies conducted by the Rovers have indicated that early Mars was characterized by impacts, explosive volcanoes, and subsurface water; whereas each Rover has discovered geologi­cal evidence of ancient Martian environments where habitable condi­tions may have existed; whereas the Rovers have explored over 21 kilometers of Martian terrain, climbed Martian hills, descended deep into large craters, survived dust storms, and endured three cold, dark Martian winters; and whereas Spirit and Opportunity will have passed 5 years of successful operation on the surface of Mars on January 3, 2009, and January 24, 2009, respectively, far exceeding the original 90-Martian day mission requirement by a factor of 20, and are con­tinuing their missions of surface exploration and scientific discovery: Now therefore be it resolved, that the House of Representatives com­mends the engineers, scientists, and technicians of the Jet Propul­sion Laboratory and Cornell University for their successful execution and continued operation of the Mars Exploration Rovers, Spirit and Opportunity; and recognizes the success and significant scientific contributions of NASA’s Mars Exploration Rovers.2

A Family Portrait

The Voyagers took a part of the Solar System that had been studied briefly and in little detail, and fleshed it out into a family portrait of four giant planets, their ring systems and magnetic fields, plus forty-eight of their moons. The additions and revisions have been enough to cause textbooks on astronomy to be rewritten.13 Let’s see what was learned about major members of the family.

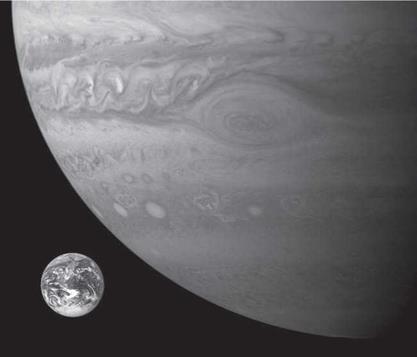
First up was Jupiter. This mighty gas giant is three times more massive than any other planet and 320 times more massive than the Earth (figure 4.2). The Voyagers reached Jupiter in 1979, with a separation of four months. Even after centuries of telescopic ob­servations, there were surprises. The Great Red Spot was revealed to be a huge anticyclone, large enough to swallow the Earth, with eddies and smaller storms around its periphery. It had changed color from orange to dark brown in the six years since the Pio­neer flybys. As they passed behind the planet the Voyagers saw lightning illuminating the darkness of the night-side atmosphere.14 Voyager 1 discovered a very faint ring system around Jupiter made of dust ejected from the inner moons after high-velocity impacts.15 The rings are far less dramatic than Saturn’s but are equally inter­esting scientifically. The main ring circles from 122,000 to 129,000 kilometers away from the center of the planet.

Voyager 1 discovered two substantial new moons of Jupiter: Thebe and Metis. Both are irregular in shape; Thebe is 70 miles in its largest dimension and Metis is only 35 miles long.16 Voyager 2 got into the act by discovering Adrastea, which is no bigger than a small town, 15 miles across. However, the real excitement came from Io, Jupiter’s closest moon and the fourth largest moon in the Solar System. This strange-looking rock, with its mottled yellow-

A Family Portrait

Figure 4.2. The Earth and Jupiter compared. The biggest atmospheric phenom­ena on Jupiter, like the Great Red Spot pictured here, rival the Earth in size and persist for centuries. The Voyagers provided new and unprecedented detail on the atmospheric properties of all four gas giants, and indirect evidence that they possess rocky cores (NASA Planetary Photojournal).

brown surface, looking like a moldy orange, is the most geolog­ically active world in the Solar System. The Voyagers saw nine erupting volcanoes between them, marking the first time active volcanism had been seen anywhere other than the Earth. Plumes shoot out of the volcanoes at up to 2,000 mph and rise 300 miles above Io’s surface.17 There are more than 400 volcanoes dotting the moon’s surface, not all of which are active.

Why is Io so lively? Normally, moons are geologically dead be­cause there’s not enough radioactive heating from their interior rocks to drive tectonic activity. But Io is in a gravitational “tug of war” with nearby Jupiter and the other three Galilean moons: Ganymede, Callisto, and Europa. This incessant pulling and push­ing heats up the interior of the moon, like a racquetball heats up when it’s flexed repeatedly. Io is distorted by the stretching force of Jupiter’s gravity, and this departure from a sphere is called a tidal bulge. It bulges by up to 300 feet, which is enormous compared to the roughly one-foot stretching of the Earth’s solid mass by the Moon. Sulfur and oxygen atoms ejected by the volcanoes create a torus of plasma around Jupiter, and these ionized atoms have been detected millions of miles away, right to the edge of Jupiter’s mag­netosphere. Lava flows episodically paint the surface red, orange, and yellow, and fizz off enough material to coat the entire surface with an inch of sulfur every year.

Galileo’s other “children of Jupiter” turned out to have distinct personalities as well (plate 5). Ganymede is the largest moon in the Solar System, even larger than Mercury and more than twice as big as Pluto, which has seemed poor and misbegotten since astrono­mers demoted it to the status of a dwarf planet in 2006. Gany­mede has terrain that’s partially cratered and partially grooved, which is thought to indicate tectonic processes. Rocks mixed with ice comprise the top layer. More recent observations point to a liquid ocean under the icy crust.18 The Voyagers saw huge impact craters on Callisto, with a couple indicating impacts almost large enough to blast the moon into fragments. However, the craters were strangely smooth, with almost no topographic relief, indicat­ing that water ice at one point had flowed over them and filled them in. Europa attracted keen attention from the mission sci­entists when the first images came back. Low-resolution pictures from Voyager 1 showed linear features crisscrossing the surface. Higher resolution pictures from Voyager 2 increased the puzzle be­cause the features were so flat they couldn’t have been created by the familiar terrestrial process of slabs of crust sliding and collid­ing with each other. The only plausible explanation was that they were ice floes. Other observations pointed to a liquid ocean tens of kilometers deep under the few kilometers of ice. Europa vaulted into its current position as one of the most compelling targets for a future lander.19

The Voyager flybys of Saturn took place in 1980 and 1981. They got four times closer to Saturn’s cloud-tops than they did to

Jupiter’s upper atmosphere.20 Saturn’s magnificent rings were the source of many puzzles and a few surprises. Viewed up close, the rings had incredibly detailed structure. Not only were there con­centric rings and gaps ranging from large and fuzzy to razor-sharp, but the cameras revealed radial spokes, kinks, and delicate braids. Time-lapse photography proved that some of these features came and went. The rings were made of mixed icy and rocky particles ranging from microscopic to house-sized, shepherded by Saturn’s many small and irregularly shaped moons.

The rings of Saturn and the other gas giants are the result of an amazingly subtle gravitational dance. With no choreographer other than Newton’s Law of Gravity, a disk of rocky and dusty material can naturally develop very complex structure. A reso­nance occurs for any pair of orbits where the periods are related by two small integers. In that case the two objects have a boosted interaction that can cause them to rearrange their position, cause one to be ejected from the system, or cause either one to clear out small particles in a ring at a particular radius. Some resonances are stable, such as the orbits of Jupiter’s moons Ganymede, Europa, and Io, which have orbital periods related by the ratio 1:2:4. Think of a child on a swing; you can sustain or increase their motion not only by pushing them once per cycle of their motion, but also every second cycle or every third cycle, and so on. Although the principles of orbital resonance are understood, not all the subtle features in Saturn’s rings have yet been explained. Voyager also earmarked Saturn’s large moon Titan as a place to return to. Titan has a thick atmosphere of nitrogen and was inferred to have bod­ies of liquid ethane and methane on its surface. As we’ll see in the next chapter, Cassini did give Titan the attention it deserved twenty years later.

Very little was known about dark and shadowy family members Uranus and Neptune before Voyager. The highlights of Voyager 2’s solo flybys of the two outermost planets included the discovery that the magnetic fields are tilted far from their rotation axes. The new data trebled the number of moons of Uranus from 5 to 15 (27 are now known, most named after characters in the plays of Wil­liam Shakespeare and a few named after characters in Alexander Pope’s poem “The Rape of the Lock”), and it doubled the num­ber of moons of Neptune from three to seven (thirteen are now known, named after Greek and Roman water gods). Miranda, the innermost of Uranus’s five large moons, is a bizarre object. Even though it’s only 300 miles in diameter, it has huge canyons and terraces ten miles high and mixed young and old surfaces. Voyager scientists thought it might have been the pieces of a smashed moon that came back together, but now it’s thought that Miranda’s to­pography arose from tidal heating at a time when it was in a much more eccentric orbit than it is now. Neptune rounds out the fam­ily portrait. This frigid and gloomy planet has howling winds of 1,200 mph and a Great Dark Spot similar in size to Jupiter’s Great Red Spot.21 Its large moon Triton might have been kept molten for a billion years after its capture by Neptune; geysers on its surface spew soot and nitrogen gas into its sparse atmosphere. Triton is the coldest place in the Solar System: -391 °F, a temperature at which the air we breathe would freeze solid.

What Cassini Discovered

Cassini has rewritten the book on Saturn, making many scientific discoveries; the first six years of study were summarized in 2010 in two papers in the journal Science.19 Two of the greatest advances were conceptual. The first was to paint a sharply etched portrait of a gas giant planet and its moons as intriguing worlds with “per­sonalities” and quirks that made them noteworthy. Voyager paved the way, but Cassini got closer to its targets and spent a larger amount of time in their neighborhood. Another realization was the plausibility of the outer Solar System for biology. Although far from the Sun’s warming rays, the largest of Saturn’s moons get internal energy from radioactive decay of their rocky material, and many of the moons get extra heat by being tidally “squeezed” by the gravity of the massive planet. If life’s minimum requirements are energy, liquid water, and organic material, those conditions may be met on half a dozen of the moons of Saturn. This animates the search for life elsewhere in the universe, since giant planets with attendant moon systems are expected to be commonplace.

Not all scientific data are equally digestible to public audiences. Spectra or measures of magnetic field strengths and charged par­ticle fluxes are abstract and esoteric without a lot of background information and context. So the general awareness of Cassini has been based on its imaging. In that respect the Imaging Science Sub­system is preeminent, and ISS team leader Carolyn Porco has been an eloquent spokesperson for why we should care about the outer planets and their moons. The portraits made of the Saturn system, best seen at a glance in a poster mosaic of sixty-four scenes from Saturn on the ciclops. org website, are an eloquent testimony to the interplay of shadows and light in the realm where there’s no air to diffuse and scatter light. The shadows of moons fall on rings, or on each other, and shallow-angled light casts deep shadows on the hills and pock-marked surfaces of the moons. The chiaroscuro is worthy of Caravaggio. In fact, there’s an unbroken lineage in the natural depiction of strong light and shadow that connects Leon­ardo and Galileo’s sketches of the Moon, Bonestell’s paintings, and the actual images from Cassini.

The science started flowing long before Cassini got to Saturn. As it passed Jupiter to get a gravity assist, the spacecraft took 26,000 pictures and studied the circulation patterns that produce counter­rotating atmospheric bands on the giant planet. It also provided evidence that Jupiter’s faint ring originates from micro-meteorite impacts on the smaller moons.30 Cassini gave a nod to Albert Ein­stein with a new test of his general theory of relativity. Gravity very slightly bends and slows down light and any other form of radiation passing a massive object. Cassini sent radio signals past the Sun to the Earth so this delay could be measured. The results agreed with the predictions of general relativity theory with a pre­cision of one part in 50,000, improving on the precision of previ­ous tests by a factor of fifty.31

In 2004, Cassini discovered three new moons of Saturn, bring­ing the total to sixty-one. They’re small, between three and four kilometers across, like free-floating mountains in space. A year later it found a slightly larger moon in one of the gaps in the rings. The moons and rings engage in a complex gravitational waltz. Some gaps in the rings are caused by a moon clearing out particles at that distance, but others are caused by a more distant moon driving a resonance. If orbits have periods that are related by the ratio of two small integers, then the outer object can influence the inner one, and in the case of an outer moon, it clears out a gap in the rings, as described in the last chapter. Since there are many moons, there are many ratios that can cause resonance. Harmonic effects like this cause much of the complexity of the ring system.32

They orbit silently in the vacuum of space, but ring and moon systems have the timbre of a beautiful musical instrument, each one unique.

Cassini’s arrival at Saturn in July 2004 involved a daring and risky maneuver. It shot the gap between the F and G rings, equiva­lent to threading the eye of a needle. The High-Gain Antenna had to be pivoted away from Earth and along the flight path to protect it from hits by small particles, and then the rockets were used for a very precise deceleration that allowed Saturn to capture the space­craft. At its closest approach it skimmed just 13,000 miles above Saturn’s cloud tops. Imagine the majestic view if humans had been along for the ride, watching the towering cloudscapes of a planet so big 760 Earths would fit inside. Cassini provided fascinating new details on the ring system.33 To a casual observer it seems miraculous that such subtle and complex patterns could arise by unguided natural processes, but the gravitational mechanisms be­hind the rings have been known for decades. Cassini measured the size distribution of ring particles more accurately than before, and its data showed how ring particles can join into loose aggregations or “piles of rubble.” And, it found instances of moons stealing par­ticles from rings as well as times when moons eject particles. New data showed that the rings are 90 percent water, so they’re most similar to a huge bumper car ride with careening chunks of ice of all sizes—from microscopic to the size of a house. Surprisingly, when seen up close the rings are tinged red, which scientists specu­late is due to rust or small organic molecules mixed in with the water ice (plate 7). To the connoisseur of gravitational dynamics, there’s a life’s work in understanding the shifting spokes, the spiral density waves, the embedded moonlets, and the features that look like waves and straw and rope.34

Much of the time thereafter has been spent planning and execut­ing flybys. An early passage near Phoebe was the only one that will be possible for this curious little moon. Phoebe is one of the out­ermost moons and only 150 miles across, but parts of its heavily cratered surface appear very bright and scientists think there’s ice under the surface. The lion’s share of the flybys have been used to explore Titan. Titan is the second largest moon in the Solar System.

Only Jupiter’s Ganymede is larger. Titan is 50 percent larger than the Earth’s Moon and nearly twice the mass. It is unprecedented in having an atmosphere thicker than Earth, made of the same pri­mary ingredient, nitrogen. Setting aside episodic lava flows on Io, it’s the only object beyond Earth where stable bodies of liquid have been seen on the surface. Cassini has used radar to penetrate the thick murk of the atmosphere and reveal surface details as small as a kilometer.35

Titan’s orange haze is naturally produced photochemical smog. Methane and ethane are mixed in with the nitrogen and they form clouds and rain, which falls on the surface.36 There’s weather here but it’s a completely alien chemical environment. Other trace in­gredients include propane, acetylene, argon, and hydrogen cyanide. Add some oxygen and you’d have the recipe for a real conflagra­tion, and it’s not anything humans would want to breathe. Hydro­carbons break up and recombine in the upper atmosphere under the action of sunlight. The methane present would be converted into more complex molecules in only 50 million years, suggesting that it must be replenished from Titan’s interior. Robert Zubrin pointed out that the base of Titan’s atmosphere is so dense and its gravity is so gentle that astronauts could potentially fly by wearing powered wings attached to their arms.37

The real prize on Titan is not the chemical haze in the atmo­sphere but the glittering liquid on the surface. In late 2009, NASA released a gorgeous picture of the northern polar region, back-lit by the Sun, with a glint of specular reflection from a body of liq – uid.38 Other images show that the liquid levels do not vary by more than 3 millimeters—there’s little surface wind on Titan. The north and south polar regions are dotted with lakes varying from a mile across to larger than the largest lake on Earth. The main ingredi­ents of the lakes are likely to be methane and ethane, with smaller contributions from ammonia and water.39 Evaporation from the lakes is not enough to supply the methane seen in the atmosphere, implying even larger reservoirs of liquid methane underground. Titan is literally swimming in organic materials. There’s hundreds of times more mass of liquid hydrocarbons on Titan than the sum of all the oil and gas reserves on Earth.