Category AERONAUTICS

Hot Structures: ASSET

Dyna-Soar never flew, for Defense Secretary Robert S. McNamara can­celed the program in December 1963. At that time, vehicles were well under construction but still were some 2% years away from first flight.

Still its technology remained available for further development, and thus it fell to a related program, Aerothermodynamic/elastic Structural Systems Environmental Test (ASSET), to take up the hot structures cause and fly with them.[1055]

As early as August 1959, the Flight Dynamics Laboratory at Wright – Patterson Air Force Base launched an in-house study of a small recov­erable boost-glide vehicle that was to test hot structures during reentry. From the outset there was strong interest in problems of aerodynamic flutter. This was reflected in the ASSET concept name.

ASSET won approval as a program in January 1961. In April of that year, the firm of McDonnell Aircraft, which was already building Mercury spacecraft, won a contract to develop the ASSET flight vehi­cles. The Thor, which had been deployed operationally in England, was about to come home because it was no longer needed as a weapon. It became available for use as a launch vehicle.

Подпись: er case study on X-20).

Hot Structures: ASSET Подпись: 9

ASSET took shape as a flat-bottomed wing-body craft that used a low-wing configuration joined to a truncated combined cone-cylinder

body. It had a length of 59 inches and a span of 55 inches. Its bill of materials resembled that of Dyna-Soar, for it used TZM molybdenum to withstand 3,000 °F on the forward lower heat shield, graphite for sim­ilar temperatures on leading edges, and zirconia rods for the nose cap, which was rated at 4,000 °F. But ASSET avoided the use of Rene 41, with cobalt and columbium alloys being employed instead.[1056]

ASSET was built in two varieties: the Aerothermodynamic Structural Vehicle (ASV) weighing 1,130 pounds and the Aerothermodynamic Elastic Vehicle (AEV) at 1,225 pounds. The AEVs were to study panel flutter along with the behavior of a trailing-edge flap, which represented an aerodynamic control surface in hypersonic flight. These vehicles did not demand the highest possible flight speeds and therefore flew with single-stage Thors as the booster. But the ASVs were built to study mate­rials and structures in the reentry environment while taking data on tem­peratures, pressures, and heat fluxes. Such missions demanded higher speeds. These boost-glide craft therefore used the two-stage Thor-Delta launch vehicle, which resembled the Thor-Able that had conducted nose cone tests at intercontinental range in 1958.[1057]

The program eventually conducted six flights:[1058] several of these craft were to be recovered. Following standard practice, their launches were scheduled for the early morning, to give downrange recovery crews the maximum hours of daylight. That did not help ASV-1, the first flight in the program, which sank into the sea. Still, it flew successfully and returned good data. In addition, this flight set a milestone, for it was the first time in aviation history that a lifting reentry spacecraft had traversed the demand­ing hypersonic reentry corridor from orbit down to the lower atmosphere.[1059]

ASV-2 followed, using the two-stage Thor-Delta, but it failed when the second stage did not ignite. The next one carried ASV-3, with this mission scoring a double achievement. It not only made a good flight downrange, but it was also successfully recovered. It carried a liquid – cooled double-wall test panel from Bell Aircraft along with a molybde­num heat-shield panel from Boeing, home of Dyna-Soar. ASV-3 also had a new nose cap. The standard ASSET type used zirconia dowels, l.5 inches long by 0.5 inches in diameter, which were bonded together with a zir­conia cement. The new cap, from International Harvester, had a tung­sten base covered with thorium oxide and was reinforced with tungsten.

A company advertisement stated that it withstood reentry so well that it "could have been used again,” and this was true for the craft as a whole. Historian Richard P. Hallion writes that "overall, it was in excel­lent condition. Water damage. . . caused some problems, but not so seri­ous that McDonnell could not have refurbished and reflown the vehicle.” The Boeing and Bell panels came through reentry without damage, and the importance of physical recovery was emphasized when columbium aft leading edges showed significant deterioration. They were redesigned, with the new versions going into subsequent AEV and ASV spacecraft.[1060]

The next two flights were AEVs, each of which carried a flutter test panel and a test flap. AEV-1 returned only one high-Mach data point, at Mach 11.88, but this sufficed to indicate that its panel was probably too stiff to undergo flutter. Engineers made it thinner and flew a new one on AEV-2, where it returned good data until it failed at Mach 10. The flap experiment also showed value. It had an electric motor that deflected it into the airstream, with potentiometers measuring the force required to move it, and it enabled aerodynamicists to critique their theories. Thus one treatment gave pressures that were in good agreement with obser­vations, whereas another did not.

ASV-4, the final flight, returned "the highest quality data of the ASSET program,” according to the flight-test report. The peak speed of 19,400 ft/sec, Mach 18.4, was the highest in the series and was well above the design speed of 18,000 ft/sec. The long hypersonic glide covered 2,300 nautical miles and prolonged the data return, which presented pressures at 29 locations on the vehicle and temperatures at 39. An onboard system transferred mercury bal­last to trim the angle of attack, increasing the lift-to-drag ratio (L/D) from its average of 1.2 to 1.4, and extending the trajectory. The only important prob­lem came when the recovery parachute failed to deploy properly and ripped away, dooming ASV-4 to follow ASV-1 into the depths of the Atlantic.[1061]

Подпись: DESIGNHot Structures: ASSETOPTIMUM

HOT WING STRUCTURE

Подпись: 9 Hot Structures: ASSET Hot Structures: ASSET

NASA CR-1568

SEGMENTED LEADING EDGE

NASA concept for a hypersonic cruise wing structure formed of beaded, corrugated, and tubu­lar structural panels, 1978. NASA.

On the whole, ASSET nevertheless scored a host of successes. It showed that insulated hot structures could be built and flown without producing unpleasant surprises, at speeds up to three-fourths of orbital velocity. It dealt with such practical issues of design as fabrication, fas­teners, and coatings. In hypersonic aerodynamics, ASSET contributed to understanding of flutter and of the use of movable control surfaces. The program also developed and successfully used a reaction control system built for a lifting reentry vehicle. Only one flight vehicle was recovered in four attempts, but it complemented the returned data by permitting a close look at a hot structure that had survived its trial by fire.

Digital Fly-By-Wire: The Space Legacy

Both the Mercury and Gemini capsules controlled their reaction control thrusters via electrical commands carried by wire. They also used highly reliable computers specially developed for the U. S. manned space flight program. During reentry from space on his historic 1962 Mercury mis­sion, the first American in space, Alan Shepard, took manual control of the spacecraft attitude, one axis at a time, from the automatic attitude control system. Using the Mercury direct side controller, he "hand-flew” the capsule to the retrofire attitude of 34 degrees pitch-down. Shepard reported that he found that the spacecraft response was about the same as that of the Mercury simulator at the NASA Langley Research Center.[1151] The success of fly-by-wire in the early manned space missions gave NASA confidence to use a similar fly-by-wire approach in the Lunar Landing Research Vehicle (LLRV), built in the early 1960s to practice lunar land­ing techniques on Earth in preparation for the Apollo missions to the Moon. Two LLRVs were built by Bell Aircraft and first flown at Dryden in 1964. These were followed by three Lunar Landing Training Vehicles (LLTVs) that were used to train the Apollo astronauts. The LLTVs used a triply redundant fly-by-wire flight control system based on the use of three analog computers. Pure fly-by-wire in their design (there was insufficient weight allowance for a mechanical backup capability), they proved invaluable in preparing the astronauts for actual landings on the surface of the Moon, flying until November 1972.[1152] A total of 591 flights were accomplished, during which one LLRV and two LLTVs crashed in
spectacular accidents but fortunately did so without loss of life.[1153] During this same period, digital computers were demonstrating great improve­ments in processing power and programmability. Both the Apollo Lunar Module and the Command and Service Module used full-authority dig­ital fly-by-wire controls. Fully integrated into the fly-by-wire flight con­trol systems used in the Apollo spacecraft, the Apollo digital computer provided the astronauts with the ability to precisely maneuver their vehi­cles during all aspects of the lunar landing missions. The success of the Apollo digital computer in these space vehicles led to the idea of using this computer in a piloted flight research aircraft.

Подпись: 10By the end of 1969, many experts within NASA and especially at the NASA Flight Research Center at Edwards Air Force Base were con­vinced that digital-computer-based fly-by-wire flight control systems would ultimately open the way to dramatic improvements in aircraft design, flight safety, and mission effectiveness. A team headed by Melvin E. Burke—along with Dwain A. Deets, Calvin R. Jarvis, and Kenneth J. Szalai—proposed a flight-test program that would demonstrate exactly that. The digital fly-by-wire proposal was evaluated by the Office of Advanced Research and Technology (OART) at NASA Headquarters. A strong supporter of the proposal was Neil Armstrong, who was by then the Deputy Associate Administrator for Aeronautics. Armstrong had been the first person to step on the Moon’s surface, in July 1969 during the Apollo 11 mission, and he was very interested in fostering transfer of technology from the Apollo program into aeronautics applications. During discussion of the digital fly-by-wire proposal with Melvin Burke and Cal Jarvis, Armstrong strongly supported the concept and reportedly commented: "I just went to the Moon with one.” He urged that they con­tact the Massachusetts Institute of Technology (MIT) Draper Laboratory to evaluate the possibility of using modified Apollo hardware and soft­ware.[1154] The Flight Research Center was authorized to modify a fighter type aircraft with a digital fly-by-wire system. The modification would be based on the Apollo computer and inertial sensing unit.

YA-7D DIGITAC

Digital Flight Control for Tactical Aircraft (DIGITAC) was a joint program between the Air Force Flight Dynamics Laboratory (AFFDL) at Wright – Patterson AFB, OH, and the USAF Test Pilot School (TPS) at Edwards AFB. Its purpose was to develop and demonstrate digital flight control technology for potential use in future tactical fighter and attack aircraft, including the feasibility of using digital flight control computer technology to optimize an airplane’s tracking and handling qualities for a full range of weapons delivery tasks. The second prototype LTV YA-7D (USAF serial No. 67-14583) was selected for modification as the DIGITAC testbed by replacing the analog computer of the YA-7D Automated Flight Control System (AFCS) with the DIGITAC digital multimode flight control system that was developed by the AFFDL. The mechanical flight control system in the YA-7D was unchanged and was retained as a backup capability.

The YA-7D’s flight control system was eventually upgraded to DIGITAC II configuration. DIGITAC II used military standard data buses and transferred critical flight control data between individual computers and between computers and remote terminals. The data buses used
were dual channel wire and dual channel fiber optic and were selectable in the cockpit by the pilot to allow him to either fly-by-wire or fly-by­light. Alternately, for flight-test purposes, the pilot was able to imple­ment one wire channel and one fiber optic channel. During early testing, the channel with the multifiber cables (consisting of 210 individual fibers) encountered numerous fiber breakage problems during normal ground maintenance. The multifiber cable design was replaced by sin­gle-fiber cables with tough protective shields, a move that improved data transmission qualities and nearly eliminated breakage issues. The DIGITAC fly-by-light system flew 290 flights during a 3-year period, performing flaw­lessly with virtually no maintenance. It was so reliable that it was used to fly the aircraft on all routine test missions. The system performance and reliability was considered outstanding, with the technical approach assessed as ready for consideration for use in production aircraft.[1208]

Подпись: 10The DIGITAC YA-7D provided the TPS with a variable stability tes­tbed aircraft for use in projects involving assessments of advanced air­craft flying qualities. Results obtained from these projects contributed to the flying qualities database in many areas, including degraded-mode flight control cross-coupling, control law design, pro versus adverse yaw studies, and roll-subsistence versus roll-time-delay studies. Under a TPS project known as Have Coupling, the YA-7D DIGITAC aircraft was used to investigate degradation to aircraft handling qualities that would occur in flight when a single pitch control surface (such as one side of the horizontal stabilizer) was damaged or impaired. An asym­metric flight control situation would result when a pure pitch motion was commanded by the pilot, with roll and yaw cross-coupling motions being produced. For the Have Coupling tests, various levels of cross-cou­pling were programmed into the DIGITAC aircraft. The resulting data provided a valuable contribution to the degraded flight control mode handling qualities body of knowledge. This included the interesting finding that with exactly the same amounts of cross-coupling present, pilot ratings of aircraft handling qualities in flight-testing were signif­icantly different compared with those rating obtained in the ground – based simulator.[1209]

The TPS operated the YA-7D DIGITAC aircraft for over 15 years, beginning in 1976. It made significant contributions to advances in flight control technology during investigations involving improved direc­tional control, the effect of depressed roll axis on air-to-air tracking, and airborne verification of computer-simulated flying qualities. The DIGITAC aircraft was used to conduct the first Air Force flight tests of a digital fight control system, and it was also used to flight-test the first fiber-opti­cal fly-by-light DFCS. Other flight-test firsts included the integration of a dynamic gun sight and the flight control system and demonstrations of task-tailored multimode flight control laws.[1210] The DIGITAC YA-7D is now on display at the Air Force Flight Test Center Museum at Edwards AFB.

High Stability Engine Control

NASA Lewis (now Glenn) Research Center evaluated an automated com­puterized engine control system that sensed and responded to high lev­els of engine inlet airflow turbulence to prevent sudden in-flight engine compressor stalls and potential engine failures. Known as High Stability Engine Control (HISTEC), the system used a high-speed digital processor to evaluate airflow data from engine sensors. The technology involved in the HISTEC approach was intended to control distortion at the engine face. The HISTEC system included two major functional subelements: a Distortion Estimation System (DES) and a Stability Management Control
(SMC). The DES is an aircraft-mounted, high-speed computer proces­sor. It uses state-of-the-art algorithms to estimate the amount and type of distortion present at the engine face based on measurements from pressure sensors in the engine inlet near the fan. Maneuver informa­tion from the digital flight control system and predictive angle-of-attack and angle-of-yaw algorithms are used to provide estimates of the type and extent of airflow distortion likely to be encountered by the engine. From these inputs, the DES calculates the effects of the engine face dis­tortion on the overall propulsion system and determines appropriate fan and compressor pressure ratio commands. These are then passed to the SMC as inputs. The SMC performs an engine stability assessment using embedded stall margin control laws. It then issues actuator com­mands to the engine to best accommodate the estimated distortion.[1276]

Подпись: 10A dozen flights were flown on the ACTIVE F-15 aircraft at Dryden from July 15 to August 26, 1997, to validate the HISTEC concept, dur­ing which the system successfully directed the engine control computer to automatically command engine trim changes to adjust for changes in inlet turbulence level. The result was improved engine stability when inlet airflow was turbulent and increased engine performance when the airflow was stable.[1277]

NASA’s Involvement in Energy Efficiency and Emissions Reduction

The goal of improving aircraft fuel efficiency is one shared by aerospace engineers everywhere: with increased efficiency come the exciting pos­sibilities of reduced fuel costs and increased performance in terms of speed, range, or payload. American engineers recognized the potential early on and were quick to create a center of gravity for their efforts to improve the fuel efficiency of aircraft engines. The NACA established the Aircraft Engine Research Laboratory—later known as NASA Lewis and then NASA Glenn—in 1941 in Cleveland, OH, as the Nation’s nerve
center for propulsion research.[1376] The lab first worked on fast fixes for pis­ton engines in production for use in World War II, but it later moved on to pursue some of America’s most forward-leaning advances in jet and rocket propulsion.[1377] Improving fuel efficiency was naturally at the cen­ter of the laboratory’s propulsion research, and many of NASA’s most important fuel-saving engine concepts and technology originated there.[1378] While NASA Glenn spearheaded the majority of aircraft fuel efficiency research, NASA Langley also played a critical role in the development of new fuel-saving aircraft structures.[1379]

Подпись: 12NASA’s efforts to develop aircraft technology that both increased fuel efficiency and reduced emissions reached their nadir in the 1970s. From the time of Sputnik to the late 1960s, space dominated NASA’s focus, par­ticularly the drive to land on the Moon. But in the late 1960s, and partic­ularly after introduction of the wide-body Boeing 747, the Agency turned increasing attention toward air transport, consistent with air transport itself dramatically increasing as a means of global mobility. Government and airline interest in improving jet fuel efficiency was high. However, NASA Lewis struggled to reenter the air-breathing propulsion game because the laboratory had lost much of its aeronautics expertise during the Sputnik crisis and now faced competition for Government support.[1380] Aircraft engine companies had developed their own research facilities, and the U. S. Air Force (USAF) had completed its propulsion wind tunnel facility at Arnold Engineering Development Center in Tullahoma, TN, in 1961.[1381] [1382] NASA scientists and engineers needed a new aeronautics niche. Luckily for them, they found it with the arrival of the oil embargo of 1973 and the coinciding emergence of a national awareness of environmen­tal concerns. NASA’s "clean and green” research agenda had been born.

The Organization of the Petroleum Exporting Countries (OPEC) oil embargo led Americans to realize that the Nation’s economy and military
were far too dependent on foreign sources of energy. In 1973, 64 percent of U. S. oil imports came from OPEC countries.11 The airline industry was particularly hard hit; jet fuel prices jumped from 12 cents to over $ 1 per gallon, and annual fuel expenditures increased to $1 billion— triple the earnings of airlines.[1383] During the oil crisis, fuel accounted for half the airlines’ operating costs,[1384] and those operating costs were ris­ing faster than the rate of inflation and faster than efficiencies in the air­lines’ own operations could reduce them.[1385] The airline lobby descended on Capitol Hill, warning that its struggles to maintain profitability in the face of rising fuel costs were a bellwether for the Nation’s entire econ­omy. Lawmakers turned to NASA to for help.

Подпись: 12In 1975, the U. S. Senate asked NASA to create the Aircraft Energy Efficiency (ACEE) program, with the twin goals of lowering the fuel burn of existing U. S. commercial aircraft and building new fuel – efficient aircraft to match foreign competition.[1386] The 10-year, $670 mil­lion ACEE yielded two of NASA’s greatest contributions to aircraft fuel – efficiency research. The most significant was the Energy Efficient Engine (E Cubed) program, which spawned technology still used in gas tur­bine engines today. The second key element of ACEE was the Advanced Turboprop (ATP), a bold plan to build an energy-efficient open-rotor engine. The open-rotor concept never made it into the mainstream, but aircraft propulsion research today still draws from ATP concepts, as this case study will later explain. Other technology developed under ACEE led to improved aerodynamic structures and laminar flow, as well as the design of supercritical wings, winglets, and composites.

Around the same time as ACEE, NASA began to sharpen its focus on the reduction of aircraft emissions. Space exploration had opened the Nation’s eyes to the fragility of the planet and the potential impact that

NASA's Involvement in Energy Efficiency and Emissions Reduction Подпись: 12

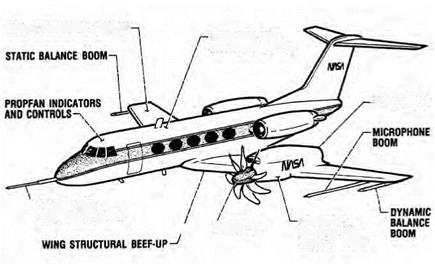
ELEMENTS NEEDED FOR DEVELOPMENT OF ADVANCED
TURBOPROP AIRCRAFT

humans could have on the environment.[1387] The U. S. Congress pushed NASA to become increasingly involved in projects to study the impact of stratospheric flight on the ozone layer following the cancellation of the Supersonic Transport (SST) in 1971. The Agency provided high-alti­tude research aircraft, balloons, and sounding rockets for the Climactic I mpact Assessment Program (CIAP), which was launched by the Department of Transportation (DOT) to examine whether the environ­mental concerns that helped kill the SST were valid.[1388]

DOT and NASA’s CIAP research led to the discovery that aircraft emissions could, in fact, damage the ozone layer. CIAP results showed that nitrogen oxides would indeed cause ozone depletion if hundreds of Concorde and Tu-144 aircraft—the Concorde’s Russian cousin—were to fly as planned. Following the release of CIAP, Congress then called on NASA to conduct further research into the impacts of stratospheric flight on the ozone layer, prompting NASA and DOT to move forward with a
series of studies that by the 1980s were pointing to the conclusion that SSTs were less dangerous to the ozone layer than first thought.[1389] The findings gave NASA reason to believe that improvements in combustor technology might be enough to effectively mitigate the ozone problem.

After conducting its breakthrough ozone research, NASA has fairly consistently included clean combustor goals in many of its aeronau­tics projects in an effort to reduce aircraft emissions (examples include the Ultra Efficient Engine Technology program and Advanced Subsonic Technology program). Today, NASA has broadened its aeronautics research to focus not only on NOx (the collective term for water vapor, nitrogen oxide, and nitrogen dioxide), but also carbon dioxide and other pollutants.[1390]

Подпись: 12NASA’s research in this area is seen as increasingly important as the view that aircraft emissions harm air quality and contribute to climate change becomes more widely accepted. The United Nations International Panel on Climate Change (IPCC) issued a report in 2007 stating that air­craft emissions account for about 2 percent of all human-generated car­bon dioxide emissions, which are the most significant greenhouse gas.[1391] The report also found that aviation accounts for about 3 percent of the potential warming effect of global emissions that could impact Earth’s cli­mate.[1392] The report forecasts that by 2050, the aviation industry (including aircraft emissions) will produce about 3 percent of global carbon dioxide and 5 percent of the potential warming effect generated by human activity.[1393]

In addition to NASA’s growing interest in climate change, the Agency’s research on improving the fuel efficiency of aircraft has also continued at a relatively steady pace over the years, although it has seemed to fluc­tuate to some extent in relation to oil prices. The oil shocks of the 1970s spurred a flurry of activity, from the E Cubed to the ATP and alterna­tive fuels research. But interest in ambitious aircraft fuel-efficiency pro­grams seemed to wane during the 1990s, when oil prices were low. Now
that oil prices are high again, however, fuel-efficiency programs seem to be back in vogue. (Several alternative fuels research efforts now under­way at NASA will be discussed later in this case study.)

Подпись: 12One example of the correlation between oil prices and the level of NASA’s interest in fuel-efficiency programs is the ATP, NASA’s ambitious plan to return to open-rotor engines. The concept never made it into mainstream use, partly because of widespread concerns that open-rotor engines are too noisy for commercial airline passengers,[1394] but also partly because fuel prices began to fall and there was no longer a demand for expensive but highly energy-efficient engines. "We were developing the ATP in the late ’70s and early ’80s during the fuel crisis. And while fuel prices went up, they didn’t continue to escalate like we originally thought they might, so the utility just went down; it just wasn’t cost effective,” said John Baughman, Manager of Military Advanced System design at General Electric (GE).[1395] With oil prices once again on the rise today, however, there are several new initiatives underway that take off where E Cubed and the ATP left off.

System Verification Units

Подпись: 13In addition to the DOE-NASA units, NASA Lewis participated with the Bureau of Reclamation in the experimentation with two other tur­bines near Medicine Bow, WY. Both of these machines were designated as system verification units (SVU) because of their purpose of veri­fying the concept of integrating wind turbine generators with hydro­electric power networks. This was viewed as an important step in the Bureau of Reclamation’s long-range program of supplementing hydro­electric power generation with wind turbine power generation. One of the two turbines was a new design developed by the Hamilton Standard Division of United Technologies Corp., a 4-megawatt WTS-4 system, in the Medicine Bow area. A Swedish company, Karlskronavarvet (KKRV), was selected as a major subcontractor responsible for the design and fabrication of the nacelle hardware. The WTS-4 had a two-blade fiber­glass downwind rotor that was 256.4 feet in diameter. For over 20 years, this 4-megawatt machine remained the largest power rated wind turbine generator ever built. In a reverse role, an additional 3-megawatt version of the same machine was built for the Swedish government, with KKRV as the prime contractor and Hamilton Standard as the subcontractor.[1507]

The other SVU turbine was a Mod-2 design. While NASA engineers determined that the initial Mod-2 wind turbine generator performance was acceptable, they noted areas where improvement was needed. The problems encountered were primarily hardware-oriented and were attributed to fabrication or design deficiencies. Identification of these problems led to a number of modifications, including changes in the hydraulic, electric, and control systems; rework of the rotor hub flange; addition of a forced-lubrication system; and design of a new low-speed shaft.

Подпись: 13 System Verification Units

Third-Generation Advanced Multimegawatt Wind Turbines—The Mod-5 Program (1980-1988)

The third-generation (Mod-5) program, which started in 1980, was intended to incorporate the experiences from the earlier DOE-NASA wind turbines, especially the Mod-2 experiences, into a final proof-of – concept system for commercial use by an electric utility company. Two construction contracts were awarded to build the Mod-5 turbines—one unit to General Electric, which was designated the Mod-5A, and one unit to Boeing, which was designated the Mod-5B. As intermediate steps between the Mod-2 and Mod-5, two conceptual studies were undertaken for fabrication of both an advanced large wind turbine designated the Mod-3 and a medium turbine designated the Mod-4. Likewise, both a large-scale Mod-5 and medium-scale Mod-6 were planned as the final Wind Energy Program turbines. The Mod-3 and Mod-4 studies, however, were not carried through to construction of the turbines, and the Mod-6 program was canceled because of budget constraints and changing pri­orities resulting from a decline in oil prices following the end of the oil
crisis of the 1970s. Also, General Electric chose not to proceed beyond the design phase with its Mod-5A. As a result, only the Boeing Mod-5B was constructed and placed into power utility service.[1508]

Подпись: 13Although its design was never built, General Electric did complete the detailed design work and all of the significant development tests and documented the entire Mod-5A program. The planned Mod-5A system contained many interesting features that NASA Lewis chose to preserve for future reference. The Mod-5A wind turbine was expected to generate electricity at a cost competitive with conventional forms of power gen­eration once the turbines were in volume production. The program was divided into three phases: conceptual design, which was completed in March 1981; preliminary design, which was completed in May 1982; and final design, which was started in June 1982. The Mod-5A was planned to have a 7.3-megawatt generator, a 400-foot-diameter two-bladed tee­tered rotor, and hydraulically actuated ailerons over the outboard 40 percent of the blade span to regulate the power and control shutdown. The blades were to be made of epoxy-bonded wood laminates. The yaw drive was to include a hydraulically actuated disk brake system, and the tower was to be a soft-designed welded steel plate cylindrical shell with a conical base. The Mod-5A was designed to operate in wind speeds of between 12 and 60 mph at hub height. The system was designed for auto­matic unattended operation and for a design life of 30 years.[1509]

The Mod-5B, which was the only Mod-5 unit built, was physically the world’s largest wind turbine generator. The Mod-5B represented very advanced technology, including an upwind teetered rotor, compact plan­etary gearbox, pitchable tip blade control, soft-shell-type tower, and a variable-speed electrical induction generator/control system. Variable speed control enabled the turbine speed to vary with the wind speed, resulting in an increase energy capture and a decrease in fatigue loads on the drive train. The system underwent a number of design changes before the final fabricated version was built. For example, the turbine originally was planned to have a blade swept diameter of 304 feet. This was increased to 420 feet and finally reduced to 320 feet because of the use of blade steel tips and control improvements. Also, the tur­bine generator was planned initially to be rated at 4.4 megawatts. This
was increased to 7.2 megawatts and then decreased to the final version 3.2 megawatts because of development of better tip control and load management. The rotor weighed 319,000 pounds and was mounted on a 200-foot tower. Extensive testing of the Mod-5B system was con­ducted, including 580 hours of operational testing and 660 hours of per­formance and structural testing. Performance testing alone generated over 72 reports reviewing test results and problems resolved.[1510]

Подпись: 13The Mod-5B was the first large-scale wind turbine to operate suc­cessfully at variable rotational speeds, which varied from 13 to 17.3 revolutions per minute depending on the wind speed. In addition, the Mod-5B was the first large wind turbine with an apparent possibil­ity of lasting 30 years. The turbine, with a total system weight of 1.3 million pounds, was installed at Kahuku on the north shore of Oahu, HI, in 1987 and was operated first by Hawaiian Electric Incorporated and later by the Makani Uwila Power Corporation. The turbine started rated power rotation July 1, 1987. In January 1988, the Mod-5B was sold to the power utility, which continued to operate the unit as part of its power generation network until the small power utility ceased operations in 1996. In 1991, the Mod-5B produced a single wind tur­bine record of 1,256 megawatthours of electricity. The Mod-5B was oper­ated in conjunction with 15 Westinghouse 600-kilowatt wind turbines. While the Westinghouse turbines were not part of the NASA program, the design of the turbines combined successful technology from NASA’s Mod-0A and Mod-2 programs.[1511]

The Mod-5B, which represented a significant decrease over the Mod-2 turbines in the cost of production of electricity, was designed for the sole purpose of providing electrical power for a major utility network. To achieve this goal, a number of changes were made over the Mod-2 systems, including changes in concepts, size, and design refinements. These changes were reflected in more than 20 engineering studies, which addressed issues such as variable pitch versus fixed pitch, optimum machine size, steel shell versus truss tower, blade aerodynamics, mate­rial selection, rotor control, tower height, cluster optimization, and
gearbox configuration. For example, the studies indicated that loads problem was the decisive factor with regard to the use of a partial span variable pitch system rather than a fixed pitch rotor system, dynamic simulation led to selection of the variable speed generator, analysis of operational data enabled a significant reduction in the weight and size of the gearbox, and the development of weight and cost trend data for use in size optimization studies resulted in the formulation of machine sizing programs.[1512]

Подпись: 13A number of design elements resulted in significant contributions to the success of the Mod-5B wind turbine. Aerodynamic improvement over the Mod-2, including improvements in vortex generators, trailing edge tabs, and better shape control, resulted in an 18-percent energy capture increase. Improved variable speed design resulted in an increase of greater than 7 percent (up to as high as 11 percent) over an equiva­lent synchronous generator system. Both cycloconverter efficiency and control optimization of rotor speed versus wind speed proved to be bet­ter than anticipated. Use of the variable speed generator system to con­trol power output directly, as opposed to the pitch power control on the Mod-2, substantially reduced blade activity, especially at below rated power levels. The variable speed design also resulted in a substantial reduction in structural loads. Adequate structural integrity was dem­onstrated for all stress measurement locations. Lessons learned during the earlier operation of the Mod-2 systems resulted in improved yaw and pitch systems. Extensive laboratory simulation of control hardware and software likewise reduced control problems compared with Mod-2 systems.[1513] In summary, the Mod-5B machine represented a reliable proof-of-concept large horizontal-axis wind turbine conversion system capable of long-life production of electricity into a power grid system, thus fulfilling the DOE-NASA program objectives.

The Mod-5B was the last DOE-NASA wind turbine generator built under the Federal Wind Energy Program. In his paper on the Mod-5B wind turbine system, Boeing engineer R. R. Douglass noted the follow­ing size versus cost problem relating to the purchase of large wind tur­bines faced by power utility companies:

. . . large scale commercialization of large wind turbines suf­fers from the chicken and egg syndrome. That is, costs of units are so high when produced one or two at a time on prototype tooling that the utilities can scarcely afford to buy them. On the other hand, industry cannot possibly afford to invest the huge capital required for an automated high rate production capability without an established order base. To break this log jam will require a great deal of cooperation between govern­ment, industry, and the utilities.[1514]

Подпись: 13Boeing noted, however, in its final Mod-5B report that: "In summary the Mod-5B demonstrated the potential to generate at least 11 percent more revenue at a given site than the original design goal. It also dem­onstrated that multi-megawatt class wind turbines can be developed with high dependability which ultimately should show up in reduced operation and maintenance costs.”[1515]

SCW Takes to the Air

Langley and the Flight Research Center entered into a joint program out­lined in a November 1968 memorandum. Loftin and Whitcomb lead a Langley team responsible for defining the overall objectives, determining the wing contours and construction tolerances, and conducting wind tun­nel tests during the flight program. Flight Research Center personnel deter­mined the size, weight, and balance of the wing; acquired the F-8A airframe and managed the modification program; and conducted the flight research program. North American Rockwell won the contract for the supercriti­cal wing and delivered it to the Flight Research Center in November 1970 at a cost of $1.8 million. Flight Research Center technicians installed the new wing on a Navy surplus TF-8A trainer.[214] At the onset of the flight pro­gram, Whitcomb predicted the new wing design would allow airliners to cruise 100 mph faster and close to the speed of sound (nearly 660 mph) at an altitude of 45,000 feet with the same amount of power.[215]

NASA test pilot Thomas C. McMurtry took to the air in the F-8 Supercritical Wing flight research vehicle on March 9, 1971. Eighty-six flights later, the program ended on May 23, 1973. A pivotal document gen­erated during the program was Supercritical Wing Technology—A Progress Report on Flight Evaluations, which captured the ongoing results of the program. From the standpoint of actually flying the F-8, McMurtry noted that: "the introduction of the supercritical wing is not expected to create any serious problems in day-to-day transport operations.” The combined flight and wind tunnel tests revealed increased efficiency of commercial aircraft by 15 percent and, more importantly, a 2.5-percent increase in profits. In the high-stakes business of international commercial aviation, the supercritical wing and its ability to increase the range, speed, and fuel efficiency of subsonic jet aircraft without an increase in required power or additional weight was a revolutionary new innovation.[216]

NASA went beyond flight tests with the F-8, which was a flight-test vehicle built specifically for proving the concept. The Transonic Aircraft Technology (TACT) program was a joint NASA-U. S. Air Force partner­ship begun in 1972 that investigated the application of supercritical wing technology to future combat aircraft. The program evaluated a modified General Dynamics F-111A variable-sweep tactical aircraft to ascertain its overall performance, handling qualities, and transonic maneuver­ability and to define the local aerodynamics of the airfoil and determine wake drag. Whitcomb worked directly with General Dynamics and the Air Force Flight Dynamics Laboratory on the concept.[217] NASA worked to refine the supercritical wing, and its resultant theory through continued comparison of wind tunnel and flight tests that continued the Langley and Flight Research Center collaboration.[218]

Whitcomb developed the supercritical airfoil using his logical cut – and-try procedures. Ironically, what was considered to be an unso­phisticated research technique in the second half of the 20th century, a process John Becker called "Edisonian,” yielded the complex super­critical airfoil. The key, once again, was the fact that the researcher, Whitcomb, possessed "truly unusual insights and intuitions.”[219] Whitcomb used his intuitive imagination to search for a solution over the course of 8 years. Mathematicians verified his work after the fact and created a formula for use by the aviation industry.[220] Whitcomb received patent No. 3,952,971 for his supercritical wing in May 1976. NASA possessed the rights to granting licenses, and several foreign nations already had filed patent applications.[221]

The spread of the supercritical wing to the aviation industry was slow in the late 1970s. There was no doubt that the supercritical wing possessed the potential of saving the airline industry $300 million annu­ally. Both Government experts and the airlines agreed on its new impor­tance. Unfortunately, the reality of the situation in the mid-1970s was that the purchase of new aircraft or conversion of existing aircraft would cost the airlines millions of dollars, and it was estimated that $1.5 bil­lion in fuel costs would be lost before the transition would be com­pleted. The impetus would be a fuel crisis like the Arab oil embargo, during which the price per gallon increased from 12 to 30 cents within the space of a year.[222]

The introduction of the supercritical wing on production aircraft centered on the Air Force’s Advanced Medium Short Take-Off and Landing (STOL) Transport competition between McDonnell-Douglas and Boeing to replace the Lockheed C-130 Hercules in the early 1970s. The McDonnell-Douglas design, the YC-15, was the first large transport with supercritical wings in 1975. Neither the YC-15 nor the Boeing YC-14 replaced the Hercules because of the cancellation of the competition, but their wings represented to the press an "exotic advance” that pro­vided new levels of aircraft fuel economy in an era of growing fuel costs.[223]

During the design process of the YC-14, Boeing aerodynamicists also selected a supercritical airfoil for the wing. They based their decision on previous research with the 747 airliner wing, data from Whitcomb’s research at Langley, and the promising performance of a Navy T-2C Buckeye that North American Aviation modified with a supercritical air­foil to gain experience for the F-8 wing project and undergoing flight tests in November 1969. Boeing’s correlation of wind tunnel and flight test data convinced the company to introduce supercritical airfoils on the YC-14 and for all of its subsequent commercial transports, includ­ing the triumphant "paperless” airplane, the 777 of the 1990s.[224]

The business jet community embraced the supercritical wing in the increasingly fuel – and energy-conscious 1970s. Business jet pioneer Bill Lear incorporated the new technology in the Canadair Challenger 600, which took to the air in 1978. Rockwell International incorporated the technology into the upgraded Sabreliner 65 of 1979. The extensively redesigned Dassault Falcon 50, introduced the same year, relied upon a supercritical wing that enabled an over-3,000-mile range.[225]

The supercritical wing program gave NASA the ability to stay in the public eye, as it was an obvious contribution to aeronautical technol­ogy. The program also improved public relations and the stature of both Langley and Dryden at a time in the 1960s and 1970s when the first "A” in NASA—aeronautics—was secondary to the single "S”—space. For this reason, historian Richard P. Hallion has called the supercritical wing program "Dryden’s life blood” in the early 1970s.[226]

Subsonic transports, business jets, STOL aircraft, and uncrewed aerial vehicles incorporate supercritical wing technology today.[227] All airliners today have supercritical airfoils custom-designed and fine – tuned by manufacturers with computational fluid dynamics software programs. There is no NASA supercritical airfoil family like the signifi­cant NACA four – and five-airfoil families. The Boeing 777 wing embod­ies a Whitcomb heritage. This revolutionary information appeared in NASA technical notes (TN) and other publications with little or no fan­fare and through direct consultation with Whitcomb. A Lockheed engi­neer and former employee of Whitcomb in the late 1960s remarked on his days at NASA Langley:

When I was working for Dick Whitcomb at NASA, there was hardly a week that went by that some industry person did not come in to see him. It was a time when NASA was being constantly asked for technical advice, and Dick always gave that advice freely. He was always there when industry wanted him to help out. This is the kind of cooperation that makes industry want to work with NASA. As a result of that sharing, we have seen the influence of supercritical technology to go just about every corner of our industry.[228]

Whitcomb set the stage and the direction of contemporary air-craft design.

More accolades were given to Whitcomb by the Government and industry during the years he worked on the supercritical wing. From NASA, he received the Medal for Exceptional Scientific Achievement in 1969, and 5 years later, NASA Administrator James Fletcher awarded Whitcomb $25,000 in cash for the invention of the supercritical wing from NASA in June 1974. The NASA Inventions and Contributions Board recommended the cash prize to recognize individual contributions to the Agency’s programs. It was the largest cash award given to an individual at NASA.[229] In 1969, Whitcomb accepted the Sylvanus Albert Reed Award from the American Institute of Aeronautics and Astronautics, the organi­zation’s highest honor for achievement in aerospace engineering. In 1973, President Richard M. Nixon presented him the highest honor for science and technology awarded by the U. S. Government, the National Medal of Science.[230] The National Aeronautics Association bestowed upon Whitcomb the Wright Brothers Memorial Trophy in 1974 for his dual achievements in developing the area rule and supercritical wing.[231]

Trying Once More: The High-Speed Research Program

While Boeing and Douglas were reporting on early phases of their HSCT studies, the U. S. Congress approved an ambitious new program for High­Speed Research (HSR) in NASAs budget for FY 1990. This effort envisioned Government and industry sharing the cost, with NASA taking the lead for the first several years and industry expanding its role as research progressed. (Because of the intermingling of sensitive and proprietary information, much of the work done during the HSR program was protected by a limited dis­tribution system, and some has yet to enter the public domain.) Although the aircraft companies made some early progress on lower-boom concepts for the HSCT, they identified the need for more sonic boom research by NASA, especially on public acceptability and minimization techniques, before they could design a practical HSCT able to cruise over land.[470]

Because solving environmental issues would be a prerequisite to developing the HSCT, NASA structured the HSR program into two phases. Phase I—focusing on engine emissions, noise around airports, and sonic booms, as well as preliminary design work—was scheduled for 1990-1995. Among the objectives of Phase I were predicting HCST sonic boom signatures, determining feasible reduction levels, and find­ing a scientific basis on which to set acceptability criteria. After hope­fully making sufficient progress on the environmental problems, Phase II would begin in 1994. With more industry participation and greater funding, it would focus on economically realistic airframe and propul­sion technologies and was hoped to have extended until 2001.[471]

When NASA convened its first workshop for the entire High-Speed Research program in Williamsburg, VA, from May 14-16, 1991, the head­quarters status report on sonic boom technology warned that "the impor­tance of reducing sonic boom cannot be overstated.” One of the Douglas studies had projected that even by 2010, overwater-only routes would account for only 28 percent of long-range air traffic, but with overland cruise, the proposed HSCT could capture up to 70 percent of all such traffic. Based on past experience, the study admitted that research on low boom designs "is viewed with some skepticism as to its practical application. Therefore an early assessment is warranted.”[472]

NASA, its contractors, academic grantees, and the manufactures were already busy conducting a wide range of sonic boom research projects. The main goals were to demonstrate a waveform shape that could be acceptable to the public, to prove that a viable airplane could be built to generate such a waveform, to determine that such a shape would not be too badly disrupted during its propagation through the atmosphere, and to estimate that the economic benefit of overland super­sonic flight would make up for any performance penalties imposed by a low-boom design.[473]

During the next 3 years, NASA and its partners went into a full-court press against the sonic boom. They began several dozen major experi­ments and studies, the results of which were published in reports and presented at conferences and workshops dealing solely with the sonic boom. These were held at the Langley Research Center in February 1992,[474] the Ames Research Center in May 1993,[475] the Langley Center in June 1994,[476] and again at Langley in September 1995.[477] The work­shops, like the sonic boom effort itself, were organized into three major

BLUNT NOSE


SHARP NOSE


NEAR FIELD


MID FIELD


GROUND


Trying Once More: The High-Speed Research Program

Trying Once More: The High-Speed Research Program

Подпись: LOW BOOM HIGH DRAGHIGH BOOM LOW DRAG

Figure 6. Low-boom/high-drag paradox. NASA.

areas of research: (1) configuration design and analysis (managed by Langley’s Advanced Vehicles Division), (2) atmospheric propagation, and (3) human acceptability (both managed by Langley’s Acoustics Division). The reports from these workshops were each well over 500 pages long and included dozens of papers on the progress or completion of various projects.[478]

The HSR program precipitated major advances in the design of super­sonic configurations for reduced sonic boom signatures. Many of these were made possible by the new field of computational fluid dynamics (CFD). Researchers were now able to use complex computational algo­rithms processed by supercomputers to calculate the nonlinear aspects of near-field shock waves, even at high Mach numbers and angles of attack. Results could be graphically displayed in mesh and grid formats that emu­lated three dimensions. (In simple terms: before CFD, the nonlinear char­acteristics of shock waves generated by a realistic airframe had involved too many variables and permutations to calculate by conventional means.)

The Ames Research Center, with its location in the rapidly growing Silicon Valley area, was a pioneer in applying CFD capabilities to aero­dynamics. At the 1991 HSR workshop, an Ames team led by Thomas Edwards and including modeling expert Samsun Cheung predicted that "in many ways, CFD paves the way to much more rapid progress

in boom minimization. . . . Furthermore, CFD offers fast turnaround and low cost, so high-risk concepts and perturbations to existing geom­etries can be investigated quickly.”[479]

At the same time, Christine Darden and a team that included Robert Mack and Peter G. Coen, who had recently devised a computer program for predicting sonic booms, used very realistic 12-inch wind tunnel mod­els (the largest yet to measure for sonic boom). Although the model was more realistic than previous ones and validating much about the designs, including such details as engine nacelles, signature measurements in Langley’s4 by 4 Unitary Wind Tunnel and even Ames 9 by 7 Unitary Wind Tunnel still left much to be desired.[480] During subsequent workshops and at other venues, experts from Ames, Langley and their local contractors reported optimistically on the potential of new CFD computer codes— with names like UPS3D, OVERFLOW, AIRPLANE, and TEAM—to help design configurations optimized for both constrained sonic booms and aerodynamic efficiency. In addition to promoting the use of CFD, for­mer Langley employee Percy "Bud” Bobbitt of Eagle Aeronautics pointed out the potential of hybrid laminar flow control (HLFC) for both aerody­namic and low-boom purposes.[481] At the 1992 workshop, Darden and Mack admitted how recent experiments at Langley had revealed limitations in using near-field wind tunnel data for extrapolating sonic boom signatures.[482]

Even the numbers-crunching capability of supercomputers was not yet powerful enough for CFD codes and the grids they produced to accu­rately depict effects beyond the near field, but the use of parallel computing held the promise of eventually doing so. It was becoming apparent that, for most aerodynamic purposes, CFD was the design tool of the future, with wind tunnel models becoming more a means of verification. As just one example of the value of CFD methods, Ames researchers were able to design an airframe that generated a type of multishock signature that might reach the ground with a quieter sonic boom than either the ramp or flattop wave forms that were a goal of traditional minimization theo­ries.[483] Although not part of the HSCT effort, Ames and its contractors also used CFD to continue exploring the possible advantages of oblique­wing aircraft, including sonic boom minimization.[484]

Since neither wind tunnels nor CFD could as yet prove the persis­tence of waveforms for more than a small fraction of the 200 to 300 body lengths needed to represent the distance from an HSCT to the surface, Domenic Maglieri of Eagle Aeronautics led a feasibility study in 1992 on the most cost effective ways to verify design concepts with realistic test­ing. After exploring a wide range of alternatives, the team selected the Teledyne-Ryan BQM-34 Firebee II remotely piloted vehicle (RPV), which the Air Force and Navy had used as a supersonic target drone. Four of these 28-feet-long RPVs, which could sustain a speed of Mach 1.3 at 9,000 feet (300 body lengths from the surface) were still available as surplus. Modifying them with low-boom design features such as specially con­figured 40-inch nose extensions (shown in Figure 7 with projected wave­forms from 20,000 feet), could provide far-field measurements needed to verify the waveform shaping projected by CFD and wind tunnel mod­els.[485] Meanwhile, a complementary plan at the Dryden Flight Research Center led to NASA’s first significant sonic boom testing there since the 1960s. SR-71 program manager David Lux, atmospheric specialist L. J. Ehernberger, aerodynamicist Timothy R. Moes, and principal investi­gator Edward A. Haering came up with a proposal to demonstrate CFD design concepts by having one of Dryden’s SR-71s modified with a low – boom configuration. As well as being much larger, faster, and higher-fly­ing than the little Firebee, an SR-71 would also allow easier acquisition of near-field measurements for direct comparison with CFD predic­tions.[486] To lay the groundwork for this modification, the Dryden Center obtained baseline data from a standard SR-71 using one of its distinc­tive F-16XL aircraft (built by General Dynamics in the early 1980s for evaluation by the Air Force as a long-range strike version of the F-16 fighter). In tests at Edwards during July 1993, the F-16XL flew as close as 40 feet below and behind an SR-71 cruising at Mach 1.8 to collect near­field pressure measurements. Both the Langley Center and McDonnell – Douglas analyzed this data, which had been gathered by a standard flight – test nose boom. Both reached generally favorable conclusions about the ability of CFD and McDonnell-Douglas’s proprietary MDBOOM pro­gram (derived from PCBoom) to serve as design tools. Based on these results, McDonnell-Douglas Aerospace West designed modifications to reduce the bow and middle shock waves of the SR-71 by reshaping the front of the airframe with a "nose glove” and adding to the midfuse­lage cross-section. An assessment of these modifications by Lockheed Engineering & Sciences found them feasible.[487] The next step would be to obtain the considerable funding that would be needed for the mod­ifications and testing.

In May 1994, the Dryden Center used two of its fleet of F-18 Hornets to measure how near-field shockwaves merged to assess the feasibil­ity of a similar low-cost experiment in waveform shaping using two SR-71s. Flying at Mach 1.2 with one aircraft below and slightly behind the other, the first experiment positioned the canopy of the lower F-18 in the tail shock extending down from the upper F-18 (called a tail-can­opy formation). The second experiment had the lower F-18 fly with its canopy in the inlet shock of the upper F-18 (inlet-canopy). Ground sensor recordings revealed that the tail-canopy formation caused two separate N-wave signatures, but the inlet-canopy formation yielded a single modified signature, which two of the recorders measured as a flat­top waveform. Even with the excellent visibility from the F-18’s bubble canopy (one pilot used the inlet shock wave as a visual cue for positioning

Trying Once More: The High-Speed Research Program

Figure 7. Proposed modifications to BQM-34 Firebee II. NASA.

his aircraft) and its responsive flight controls, maintaining such pre­cise positions was still not easy, and the pilots recommended against trying to do the same with the SR-71, considering its larger size, slower response, and limited visibility.[488]

Atmospheric effects had long posed many uncertainties in under­standing sonic booms, but advances in acoustics and atmospheric sci­ence since the SCR program promised better results. Scientists needed a better understanding not only of the way air molecules absorb sound waves, but also old issue of turbulence. In addition to using the Air Force’s Boomfile and other available material, Langley’s Acoustic Division had Eagle Aeronautics, in a project led by Domenic Maglieri, restore and digitize data from the irreplaceable XB-70 records.[489]

The division also took advantage of the NATO Joint Acoustic Propagation Experiment (JAPE) at the White Sands Missile Range in August 1991 to do some new testing. The researchers arranged for F-15, F-111, T-38 aircraft, and one of Dryden’s SR-71s to make 59 supersonic passes over an extensive array of BEAR, other recording systems, and meteorological sensors—both early in the morning (when the air was still) and during the afternoon (when there was usually more turbulence). Although meteorological data were incomplete, results later showed

Trying Once More: The High-Speed Research Program

UNMODIFIED SR-71 CONFIGURATION,
M -18. a-3.5 DEG

Trying Once More: The High-Speed Research Program

SR-71 CONFIGURATION WITH Mr DONNELL DOUGLAS-MODIFIED FUSELACE M =18. a = 3 9 DEG

am

Figure 8. Proposed SR-71 low-boom modification. NASA.

the effects of molecular relaxation and turbulence on both the rise time and overpressure of bow shocks.[490] Additional atmospheric information came from experiments on waveform freezing (persistence), measur­ing diffraction and distortion of sound waves, and trying to discover the actual relationship among molecular relaxation, turbulence, humidity, and other weather conditions.[491]

Leonard Weinstein of the Langley Center even developed a way to capture images of shock waves in the real atmosphere. He did this using a ground-based schlieren system (a specially masked and fil­tered tracking camera with the Sun providing backlighting). As shown in the accompanying photo, this was first demonstrated in December 1993 with a T-38 flying just over Mach 1 at Wallops Island.[492] All of the research into the theoretical, aerodynamic, and atmospheric aspects of sonic boom—no matter how successful—would not protect the Achilles’ heel of previous programs: the subjective response of human beings.

As a result, the Langley Center, led by Kevin Shepherd of the Acoustics Division, had begun a systematic effort to measure human responses to different strengths and shapes of sonic booms and hopefully deter­mine a tolerable level for community acceptance. As an early step, the division built an airtight foam-lined sonic boom simulator booth (known as the "boom box”) based on one at the University of Toronto. Using the latest in computer-generated digital amplification and loud­speaker technology, it was capable of generating shaped waveforms up to 4 psf (140 decibels). Based on responses from subjects, researchers selected the perceived-level decibel (PLdB) as the preferred metric. For responses outside a laboratory setting, Langley planned several additional acceptance studies.[493]

By 1994, early results had become available from two of these proj­ects. The Langley Center and Wyle Laboratories had developed mobile boom simulator equipment called the In-Home Noise Generation/ Response System (IHONORS). It consisted of computerized sound sys­tems installed in 33 houses for 8 weeks at a time in a network connected by modems to a monitor at Langley. From February to December 1993, these households were subjected to almost 58,500 randomly timed sonic booms of various signatures for 14 hours a day. Although definitive anal­yses were not available until the following year, the initial results con­firmed how the level of annoyance increased whenever subjects were startled or trying to rest.[494]

Preliminary results were also in from the first phase of the Western USA Sonic Boom Survey of civilians who had been exposed to such sounds for many years. This part of the survey took place in remote des­ert towns around the Air Force’s vast Nellis combat training range com­plex in Nevada. Unlike previous community surveys, it correlated citizen responses to accurately measured sonic boom signatures (using BEAR devices) in places where booms were a regular occurrence, yet where the subjects did not live on or near a military installation (i. e., where

Trying Once More: The High-Speed Research Program

Leonard Weinstein’s innovative schlieren photograph showing shock waves emanating from a T-38 flying Mach 1.1 at 13,000 feet, December 1993. NASA.

the economic benefits of the base for the local economy might influence their opinions). Although findings were not yet definitive, these 1,042 interviews proved more decisive than any of the many other research projects in determining the future direction of the HSCT effort. Based on a metric called day-night average noise level, the respondents found the booms much more annoying than previous studies on other types of aircraft noise had, even at the levels projected for low-boom designs. Their negative responses, in effect, dashed hopes that the HSR program might lead to an overland supersonic transport.[495]

Well before the paper on this survey was presented at the 1994 Sonic Boom Workshop, its early findings had prompted NASA Headquarters to reorient High-Speed Research toward an HSCT design that would only fly supersonic over water. Just as with the AST program 20 years ear­lier, this became the goal of Phase II of the HSR program (which began using FY 1994 funding left over from the canceled NASP).[496]

At the end of the 1994 workshop, Christine Darden discussed lessons learned so far and future directions. While the design efforts had shown outstanding progress, dispersal of the work among two NASA Centers

and two major aircraft manufacturers had resulted in communication problems as well as a certain amount of unhelpful competition. The mile­stone-driven HSR effort required concurrent progress in various differ­ent areas, which is inherently difficult to coordinate and manage. And even if low-boom airplane designs had been perfected to meet acoustic criteria, they would have been heavier and suffer from less acceptable low-speed performance than unconstrained designs. Under the new HSR strategy, any continued minimization research would now aim at lower­ing the sonic boom of the "baseline” overwater design, while propagation studies would concentrate on predicting boom carpets, focused booms, secondary booms, and ground disturbances. In view of the HSCT’s over­water mission, new environmental studies would devote more atten­tion to the penetration of shock waves into water and the effect of sonic booms on marine mammals and birds.[497]

Although the preliminary results of the first phase of the Western USA Survey had already had a decisive impact, Wyle Laboratories com­pleted Phase II with a similar polling of civilians in Mojave Desert com­munities exposed regularly to sonic booms, mostly from Edwards AFB. Surprisingly, this phase of the survey found the people there much more amenable to sonic booms than the desert dwellers in Nevada were, but they were still more annoyed by booms than by other aircraft noise of comparable perceived loudness.[498]

With the decision to end work on a low-boom HSCT, the proposed modifications of the Firebee RPVs and SR-71 had of course been can­celed (postponing for another decade any full-scale demonstrations of boom shaping). Nevertheless, some testing continued that would prove of future value. From February through April 1995, the Dryden Center conducted more SR-71 and F-16XL sonic boom flight tests. Led by Ed Haering, this experiment included an instrumented YO-3A light aircraft from the Ames Center, an extensive array of various ground sensors, a network of new differential Global Positioning System (GPS) receivers accurate to within 12 inches, and installation of a sophisticated new nose boom with four pressure sensors on the F-16XL. On eight long missions, one of Dryden’s SR-71s flew at speeds between Mach 1.25 and Mach 1.6 at 31,000-48,000 feet, while the F-16XL (kept aloft by in-flight refuel­ings) made numerous near – and mid-field measurements at distances from 80 to 8,000 feet. Some of these showed that the canopy shock waves were still distinct from the bow shock after 4,000-6,000 feet. Comparisons of far-field measurements obtained by the YO-3A flying at 10,000 feet above ground level and the recording devices on the surface revealed effects of atmospheric turbulence. Analysis of the data validated two existing sonic boom propagation codes and clearly showed how variations in the SR-71’s gross weight, speed, and altitude caused differences in shock wave pat­terns and their coalescence into N-shaped waveforms.[499]

This successful experiment marked the end of dedicated sonic boom flight-testing during the HSR program.

By late 1998, a combination of economic, technological, polit­ical, and budgetary problems (including NASA’s cost overruns for the International Space Station) convinced Boeing to cut its support and the Administration of President Bill Clinton to terminate the HSR program at the end of FY 1999. Ironically, NASA’s success in helping the aircraft industry develop quieter subsonic aircraft, which had the effect of moving the goalpost for acceptable airport noise, was one of the factors convincing Boeing to drop plans for the HSCT. Nevertheless, the HSR program was responsible for significant advances in technologies, techniques, and scientific knowledge, including a better understand of the sonic boom and ways to diminish it.[500]

The Challenge of Limit-Cycles

The success of the new electronic control system concepts was based on the use of electrical signals from sensors (primarily rate gyros and accel­erometers) that could be fed into the flight control system to control air­craft motion. As these electronic elements began to play a larger role, a different dynamic phenomenon came into play. "Limit-cycles” are a com­mon characteristic of nearly all mechanical-electrical closed-loop systems and are related to the total gain of the feedback loop. For an aircraft flight control system, total loop gain is the product of two variables: (1) the mag­nitude of the aerodynamic effectiveness of the control surface for creating rotational motion (aerodynamic gain) and (2) the magnitude of the artifi­cially created control surface command to the control surface (electrical gain). When the aerodynamic gain is low, such as at very low airspeeds, the electrical gain will be correspondingly high to command large sur­face deflections and rapid aircraft response. Conversely, when the aero­dynamic gain is high, such as at high airspeed, low electrical gains and small surface deflections are needed for rapid airplane response.

These systems all have small dead bands, lags, and rate limits (non­linearities) inherent in their final, real-world construction. When the

total feedback gain is increased, the closed-loop system will eventually exhibit a small oscillation (limit-cycle) within this nonlinear region. The resultant total loop gain, which causes a continuous, undamped limit – cycle to begin, represents the practical upper limit for the system gain since a further increase in gain will cause the system to become unstable and diverge rapidly, a condition which could result in structural failure of the system. Typically the limit-cycle frequency for an aircraft control system is between two and four cycles per second.

Notice that the limit-cycle characteristics, or boundaries, are depen­dent upon an accurate knowledge of control surface effectiveness. Ground tests for limit-cycle boundaries were first devised by NASA Dryden Flight Research Center (DFRC) for the X-15 program and were accomplished by using a portable analog computer, positioned next to the airplane, to gen­erate the predicted aerodynamic control effectiveness portion of the feed­back path.[683] The control system rate gyro on the airplane was bypassed, and the analog computer was used to generate the predicted aircraft response that would have been generated had the airplane been actually flying. This equivalent rate gyro output was then inserted into the control system. The total loop gain was then gradually increased at the analog computer until a sustained limit-cycle was observed at the control surface. Small stick raps were used to introduce a disturbance in the closed-loop system in order to observe the damping characteristics. Once the limit-cycle total loop gain boundaries were determined, the predicted aerodynamic gains for various flight conditions were used to establish electrical gain limits over the flight envelope. These ground tests became routine at NASA Dryden and at the Air Force Flight Test Center (AFFTC) for all new aircraft.[684] For subsequent production aircraft, the resulting gain schedules were programmed within the flight control system computer. Real-time, direct measurements of air­speed, altitude, Mach number, and angle of attack were used to access and adjust the electrical gain schedules while in flight to provide the highest safe feedback gain while avoiding limit-cycle boundaries.

Although the limit-cycle ground tests described above had been per­formed, the NASA-Northrop HL-10 lifting body encountered limit-cycle

oscillations on its maiden flight. After launch from the NB-52, the telem­etry data showed a large limit-cycle oscillation of the elevons. The oscil­lations were large enough that the pilot could feel the aircraft motion in the cockpit. NASA pilot Bruce Peterson manually lowered the pitch gain, which reduced the severity of the limit-cycle. Additional aerodynamic problems were present during the short flight requiring that the final landing approach be performed at a higher-than-normal airspeed. This caused the limit-cycle oscillations to begin again, and the pitch gain was reduced even further by Peterson, who then capped his already impres­sive performance by landing the craft safely at well over 300 mph. NASA engineer Weneth Painter insisted the flight be thoroughly analyzed before the test team made another flight attempt, and subsequent analysis by Robert Kempel and a team of engineers concluded that the wind tunnel predictions of elevon control effectiveness were considerably lower than the effectiveness experienced in flight.[685] This resulted in a higher aero­dynamic gain than expected in the total loop feedback path and required a reassessment of the maximum electrical gain that could be tolerated.[686]

Digital Computer Simulation

The computational mathematical models for the early simulators mentioned previously were performed on analog computers. Analog computers were capable of solving complex differential equations in real time. The digital computers available in the 1950s were mechanical units that were extremely slow and not capable of the rapid integration that was required for simulation. One difficulty with analog comput­ers was the existence of electronic noise within the equipment, which caused the solutions to drift and become inaccurate after several min­utes of operation. For short simulation exercises (such as a 10-minute X-15 flight) the results were quite acceptable. A second difficulty was storing data, such as aerodynamic functions.

The X-20 Dyna-Soar program mentioned previously posed a chal­lenge to the field of simulation. The shortest flight was to be a once – around orbital flight with a flight time of over 90 minutes. A large volume

Digital Computer Simulation

of aerodynamic data needed to be stored covering a very large range of Mach numbers and angles of attack. The analog inaccuracy problem was tackled by University of Michigan researchers, who revised the standard equations of motion so that the reference point for integration was a 300- mile circular orbit, rather than the starting Earth coordinates at takeoff. These equations greatly improved the accuracy of analog simulations of orbiting vehicles. As the AFFTC and NASA began to prepare for testing of the X-20, an analog simulation was created at Edwards that was used to develop test techniques and to train pilots. Comparing the real-time sim­ulation solutions with non-real-time digital solutions showed that the clo­sure after 90 minutes was within about 20,000 feet—probably adequate for training, but they still dictated that the mission be broken into segments for accurate results. The solution was the creation of a hybrid computer simulation that solved the three rotational equations using analog com­puters but solved the three translational equations at a slower rate using digital computers. The hybrid computer equipment was purchased for installation at the AFFTC before the X-20 program was canceled in 1963. When the system was delivered, it was reprogrammed to represent the X-15A-2, a rebuilt variant of the second X-15 intended for possible flight to Mach 7, carrying a scramjet aerodynamic test article on a stub ventral fin.[737] Although quite complex (it necessitated a myriad of analog-to-digital and digital-to-analog conversions), this hybrid system was subsequently

used in the AFFTC simulation lab to successfully simulate several other airplanes, including the C-5, F-15, and SR-71, as well as the M2-F2 and X-24A/B Lifting Bodies and Space Shuttle orbiter.

The speed of digital computers increased rapidly in the 1970s, and soon all real-time simulation was being done with digital equipment. Out – of-the-window visual displays also improved dramatically and began to be used in conjunction with the cockpit instruments to provide very real­istic training for flight crews. One of the last features to be developed in the field of visual displays was the accurate representation of the terrain surface during the last few feet of descent before touchdown.

Simulation has now become a primary tool for designers, flight-test engineers, and pilots during the design, development, and flight-testing of new aircraft and spacecraft.