Category Archimedes

THE INTERNATIONAL TRIALS

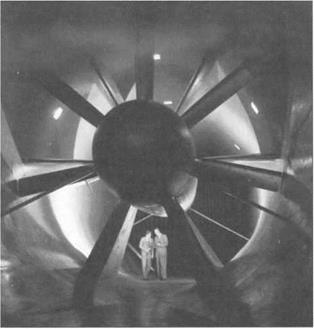
After the war was over, British aeronautical engineers conceived a project for comparing and subsequently standardizing wind tunnel data. The original idea came from Director of Research Robert Brooke-Popham.23 In a letter to the Aerodynamics subcommittee of February 1920, he referred to a previous comparison between wind tunnel tests at the NPL, Eiffel’s Laboratory, and MIT. It was desirable, he believed, to conduct another set of such comparative tests at representative laboratories in Britain, France, and the United States. For this purpose, he suggested that identical airplane models, airscrews, and stream-lined bodies be tested.24

Accepted by the subcommittee members, the proposal was sent to the Main Committee. The Main Committee approved the proposal and ordered the subcommittee to direct this international project.25 At the same time, the Main Committee sent letters to the four foreign organizations mentioned by Brooke-Popham: the Aerotechnical Institute at St. Cyr, the laboratory of Gustave Eiffel, the Central Aeronautical Institute in Italy, and the NACA. Shortly afterwards, the British Committee received letters of acceptance from all the laboratories together with comments and suggestions on the proposed project.26 The NPL began to construct standard models, and the decade-long “International Trials” project started.

By the end of 1920, three other countries had joined this international project. In August of 1921, the Imperial Research Service for Aviation in the Netherlands asked to be included in the International Trials. Once it was learned from the Controller of Information that this institution was a government establishment, the Committee approved the inclusion of the Amsterdam laboratory.27 Likewise, the requests to participate from the Associate Air Research Committee of Canada and the Japanese Imperial Navy were both approved. It was decided that the models be sent to Japan after the completion of tests in Canada.28

By this time, the British Committee had become aware of the possible importance of aerodynamic research at the Gottingen Aerodynamics Institute in Germany.29 Through some fragmentary information, the British had learned that the aerodynamic research at Gottingen lay at the heart of the wartime achievements of German aeronautical research. The Royal Aircraft Establishment (RAE, the former Royal Aircraft Factory) sent two investigators, Hermann Glauert and Robert McKinnon Wood, to visit Prandtl’s laboratory.30 Members of the Aeronautical Research Committee naturally agreed on the desirability of cooperating with the Gottingen Laboratory. The Committee reported to the Air Ministry that it was prepared to ask the allied laboratories about their willingness to cooperate with Prandtl unless there were any official difficulties.31

At the next ARC meeting, however, the Committee members were informed by the Director of Research that the Air Council deemed it undesirable to approach

Prandtl to enquire about his laboratory’s participation in the International Trials. The message from the Air Council frustrated some Committee members. Glauert and Wood had just returned from their visit to Gottingen and had submitted a report on the theoretical achievements and the experimental facilities of the Gottingen Aerodynamics Institute. Wood’s report had specifically referred to the desirability of including the Gottingen team in the International Trials, since a discrepancy had been perceived between German and British testing of the same form of wing.32 ARC Chairman Glazebrook restated his belief in the scientific importance of the participation of Prandtl’s Laboratory, calling attention to the excellence of the Gottingen wind tunnel, which possessed a steadiness and uniformity of air flow comparable with the NPL wind tunnel. Despite Glazebrook’s appeal, the Director of Research insisted that the matter not be raised again with the Air Council at this time.33 Just why the Air Council was opposed to the contact between the British Committee and the German laboratories is not recorded in its minutes. A later ARC minute indicates that the Council’s opposition sprang from diplomatic reasons.34

The International Trials entailed two different tests:

1. Determination of lift, drag, and center of pressure on a standard airfoil model at various angles of attack.

2. Resistance measurement of an airship model with and without fins.35

Accordingly, the NPL and the RAE constructed an airfoil model of the type R. A.F. 15 and an airship model of the type R.33. These were first measured in two wind tunnels of the NPL and in three tunnels of the RAE.36 They were then sent to France in the spring of 1922 to be measured both at St. Cyr and Eiffel’s Laboratory. After their return from France early in 1923, they were measured again at the NPL to see if their travel or experiments had resulted in any changes. Then they were dispatched to the United States, and measured at the NACA laboratory at Langley Field and at MIT. They returned to England in September 1924. Checked once more, the models were forwarded to Italy. The same procedure was carried out for the Netherlands, Canada, and Japan. This long and cumbersome process took several years to complete.

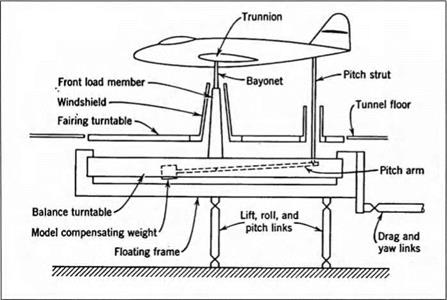
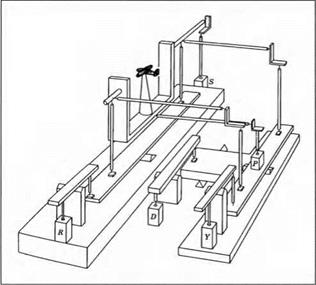
The same model was used in every test. The model was carefully constructed and repeatedly examined in order to ensure that its size and shape had not altered. Otherwise, all detailed experimental procedures of measuring the forces and moments were left to individual experimenters. Even at the same institution, two different groups may have employed different procedures. At the NPL, for example, two groups, each consisting of two engineers, used the seven-foot wind tunnels #1 and #2, and turned in different reports on their experimental procedures. For example, the group for the #2 tunnel used a specially designed optical device to check the sensitivity of the aerodynamical balance, while the other group did not use such an instrument. Despite these minor differences, they shared the basic procedure, and applied the same corrections due to the drags of wire, the spindle, the sting, and so forth.37

SOCIOLOGY ON THE FLIGHTDECK

In the NTSB’s final judgment of probable cause was an explicit reference to the fact that the captain failed to reject the takeoff “when his attention was called to anomalous engine instrument readings.” Though not formalized in the probable cause assessment, the investigative team did comment elsewhere in the report that the Safety Board strongly believed in the training program of command decision, resource management, role performance, and assertiveness. As the NTSB pointed out, it had already, in June of 1979 (A-79-47), recommended flightdeck resource management, boosting the merits of participative management and assertiveness training for other cockpit crewmembers. Here a new analytical framework entered, in which causal agency fell not to individual but to group (social) psychology. That framework (dubbed Cockpit Resource Management or CRM) was fairly recent and came in the wake of what became a set of canonical accidents. The NTSB – interpreted record of Air Florida flight 90 became a book in that canon.

For United Airlines, the transformation in their view of CRM came following the December 28, 1978 loss of their flight UA 173. Departing Denver with 46,700 pounds of fuel, with 31,900 predicted necessary for the leg to Portland, the DC-8 came in for final approach. When the gear lowered, those in the body of the plane heard a loud noise and sharp jolt. The captain felt that the gear had descended too rapidly, and noted that the gear lights did not illuminate. Asking his second officer to “give us a current card on weight, figure about another fifteen minutes,” he received a query in reply, “fifteen minutes?” To this, the captain responded “Yeah, give us three or four thousand lbs. on top of zero fuel weight.” Second officer: “not enough. Fifteen minutes is really gonna really run us low on fuel here,” then later: “we got about three on the fuel and that’s it.” When the first officer urged, “We’re going to lose an engine,” the captain responded “why?” To which the first officer responded “Fuel!” Within eight minutes the plane was down in the woods outside the city, with a loss of ten lives.19 The canonical interpretation read the accident in terms of a failure of communication: Why, United Airlines personnel wanted to know, was the captain not listening to his officers?

According to United Airlines’ CRM curriculum of the mid 1990s, the conversion of Delta Airlines to CRM came seven years after the United 173 crash, in the aftermath of its own disastrous flight 191. Approaching Dallas Fort Worth airport on August 2, 1985, Delta’s L-1011 hit a microburst, descended into the ground, and disintegrated. The question raised by investigators was why the otherwise prudent captain had entered an area of known lightning – that is to say a thunderstorm – close to the ground and in a shaft of pounding rain. “Probable cause” included the decision to enter the cumulonimbus area, a lack of training in escape from windshear, and lack of timely windshear warning. Unlike the captain of United 173 or Air Florida 90, no one suggested here that the Delta captain was not listening to the flightcrew. Instead, “given the fact that the captain was described as one who willingly accepted suggestions from flightcrew members,” the Board did not infer that they were intimidated by him. But because neither first nor second officer dissented from the continued approach, the NTSB held the flightcrew responsible for the decision to continue. “Suggestions were not forthcoming,” concluded the investigation, on the basis of which the NTSB argued that air carriers should provide formal cockpit resource management and assertiveness training for their crews.20

When, in the mid 1980s, the airlines began to develop their CRM courses, they invariably turned back to the by-then widely-discussed proceedings of a meeting held

under NASA’s auspices in San Francisco over 26-28 June 1979. In various ways, that conference set out the outline for hundreds of courses, books, and pamphlets designed to characterize and cure the “dangerous” failures of communication on the flightdeck. Most prominent among the speakers was Robert Helmreich, a social psychologist from the University of Texas at Austin, who came to the problem through his work on Navy and NASA crew training efforts for the space program. Psychology (Helmreich declared at the San Francisco meeting) had so far failed those in the cockpit. On one side, he noted, there was personality psychology which had concentrated solely on exclusion of unacceptable candidates, failing utterly to capture the positive individual qualities needed for successful flight. On the other side, Helmreich contended, social psychologists had so far ignored personality and focused on rigorous laboratory experiments only loosely tied to real-life situations. Needed was an approach that joined personality to social interaction. To this end he advocated the representation of an individual’s traits by a point on a two-dimensional graph with instrumentality on one axis and expressivity on the other. At the far end of instrumentality lay the absolutely focused goal-oriented pilot, on the extreme end of expressivity lay the pilot most adept at establishing “warmer” and more effective personal relationships. In a crisis, (argued the authors of United’s CRM course) being at the high end of both was crucial, and likely to conflict with the “macho pilot” who is high in instrumentality and low in expressivity.21

In various forms, this two-dimensional representation of expressivity and instrumentality crops up in every presentation of CRM that I have seen. Perhaps the most sophisticated reading of the problem came in another plenary session of the 1979 meeting, in the presentation by Lee Bolman from the Harvard Graduate School of Education. Bolman’s idea was to pursue the mutual relations of three different “theories”: first, there was the principals’ short-term “theory of the situation” which captured their momentary understanding of what was happening, here the pilots’ own view of the local condition of their flight. Second, Bolman considered the individual’s longer-term “theory of practice,” that collection of skills and procedures accumulated over a period of years. Finally, at the most general level, there was a meta-theory, the “theory-in-use” that contained the general rules by which information was selected, and by which causal relationships could be anticipated. In short, the meta-theory provided “core values,” “beliefs,” “skills,” and “expected outcomes.” Deduced from observation, the “theory in use” was the predictively successful account of what the subject will actually do in specific situations. But Bolman noted that this “theory-in-use” only partially overlapped with views that the subject may explicitly claim to have (“the espoused theory”). Espoused knowledge was important, Bolman argued, principally insofar as it highlighted errors or gaps in the “theory in use”:

Knowledge is “intellectual” when it exists in the espoused theory but not in the theory-in-use: the individual can think about it and talk about it, but cannot do it. Knowledge is “tacit” when it exists in the theory-in-use but not the espoused theory; the person can do it, but cannot explain how it is done. Knowledge is “integrated” when there is synchrony between espoused theory and theory-in-use: the person can both think it and do it.22

Bottom line: Bolman took the highest level theory (“theory-in-use”) to be extremely hard to revise as it involved fundamental features of self-image and lifelong habits. The lowest level theory (“theory of the situation”) might be revised given specific technical inputs (one gauge corrected by the reading of two others) but frequently will only actually be revised through an alteration in the “theory of practice.” It was therefore at the level of a “theory of practice” that training was most needed. Situations were too diverse and patterns of learning too ingrained to be subject to easy alteration. At this level of practice could be found the leamable skills of advocacy, inquiry, management, and role modification. And these, Bolman and the airlines hoped, would contribute to a quicker revision of a faulty “theory of the situation” when one arose. CRM promised to be that panacea.

Textbooks and airlines leaped at the new vocabulary of CRM. Stanley Trollip and Richard Jensen’s widely distributed Human Factors for General Aviation (1991) graphed “relationship orientation” on the у-axis against “task orientation” on the abscissa. High task orientation with low relationship orientation yields the dreadful amalgam: a style that would be “overbearing, autocratic, dictatorial, tyrannical, ruthless, and intimidating.”

According to Trollip and Jensen, who took United 173, Delta 191, and Air Florida 90 as principal examples, the co-pilot of Air Florida 90 was earnestly asking after take-off procedures when he asked about the slushy runway departure, and was (according to the authors) being mocked by captain Wheaton in his response “unless you got something special you’d like to do,” a mockery that continued in the silences with which the captain greeted every subsequent intervention by the co­pilot.23 Such a gloss assumed that copilot Pettit understood that the EPR was faulty and defined the catastrophe as a failure of his advocacy and the captain’s inquiry. Once again agency and cause were condensed, this time to a social, rather than, or in addition to, an individual failure. Now this CRM reading may be a way of glossing the evidence, but it is certainly not the only way; Pettit may have noted the discrepancy between the EPR and N1, for example, noted too that both engines were reading identically, and over those few seconds not known what to make of this circumstance. I want here not to correct the NTSB report, but to underline the fragility of these interpretive moments. Play the tape again:

F. O. Pettit (CAM-1): “That’s not right… well …”

Captain Wheaton (CAM-1): “Yes it is, there’s eighty”

Pettit (CAM-2): “Naw, I don’t think that’s right …. Ah, maybe it is.”

Wheaton (CAM-1): “One hundred twenty”

Pettit (CAM-2): “I don’t know.”

Now it might be that in these hesitant, contradictory remarks Pettit is best understood to be advocating a rejected takeoff. But it seems to be at least worth considering that when Pettit said, “I don’t know,” that he meant, in fact, that he did not know.

United Airlines put it only slightly differently than Trollip and Jensen when the company used its instructional materials to tell new captains to analyze themselves

SOCIOLOGY ON THE FLIGHTDECK

The Grid Approach To Job Performance

A study of how the Grid framework applies to the cockpit can aid individuals in exploring alternative possibilities of behaviour which may have been unclear. Understanding these concepts can enable a person to sort out unsound or ineffective behavior and replace it with more effective behaviors.

The Grid below can be used as a frame of reference to study how each crewmember approaches a job.


SOCIOLOGY ON THE FLIGHTDECK

High


0

a.

о

£

w

a

E

0

о

e

8


Low


Figure 4. United CRM Grid. Source: United Airlines training manual, “Introduction to Command/Leadership/Resource Management,” MN-94, 10/95, p. 9.


and others on the Grid, a matrix putting “concern for people” against “concern for performance.” Each of several decision-making elements then get graphed to the Grid: inquiry, advocacy, conflict resolution, and critique. Inquiry, for example, comes out this way in the (1,9) quadrant: “I look for facts, decisions, and beliefs that suggest all is well; I am not inclined to challenge other crewmembers” and in the (9,1) quadrant as “I investigate my own and others’ facts, decisions, and beliefs in depth in order to be on top of any situation and to reassure myself that others are not making mistakes.”24 United’s gloss on Flight 90’s demise is not much different from that of Trollip and Jensen: the first officer made various non-assertive comments “but he never used the term, ‘Abort!’ The Captain failed to respond to the inquiry and advocacy of the First Officer.”25

Not surprisingly, the 747 pilot I quoted before, Robert Buck, registered, in print, a strenuous disagreement. After lampooning the psychologists who were intruding on his cockpit, Buck dismissed the CRM claim that the accident was a failure of assertiveness. “Almost any pilot listening to the tape would say that was not the case but rather that the crew members were trying to analyze what was going on. To further substantiate this is the fact the copilot was well-known to be an assertive individual who would have said loud and clear if he’d thought they should abort.”26 With snow falling, a following plane on their tail, АТС telling them to hurry, and the raging controversy over VI still in the air, Buck was not at all surprised that neither pilot aborted the launch.

Again and again we have within the investigation a localized cause in unstable suspension over a sea of diffuse necessary causes.27 We find agency personalized even where the ability to act lies far outside any individual’s control. And finally, we find a strict and yet unstable commitment to protocol even when, in other circumstances, maintenance of that protocol would be equally condemned. In flight 90 the final condemnation fell squarely on the shoulders of the captain. According to the NTSB, Wheaton’s multiple errors of failing to deice properly, failing to abort, and failing to immediately engage full power doomed him and scores of others.

I now want to turn to a very different accident, one in which the captain’s handling of a crippled airliner left him not condemned but celebrated by the NTSB. As we will see even then, the instabilities of localized cause, protocol, and the human/technological boundary pull the narrative into a singular point in space, time, and action, but always against the contrary

The First Commercial U. S. Transports

The first contracts for commercial jet transports in the United States were signed in 1955.24 The Boeing 707 and the initial version of the Douglas DC-8 were to be powered by a commercial version of P&W’s J-57, designated the JT3C-6. The intercontinental Boeing 720 and an intercontinental version of the DC-8 were to be powered by a commercial version of P&W’s J-75, designated the JT4A. The first contract for General Dynamics’ Convair 880 was signed in 1956. It was to be powered by a commercial version of GE’s J-79, designated the CJ805-3. All three of these commercial engines were slightly modified versions of their military counterparts, sans afterburner.25 These changes were minor, however. In effect, the military had borne virtually all the cost of developing the high performance engines that powered the first commercial U. S. transports. Two of these engines, the CJ805 and the JT3C, ended up providing the requisite high performance gas generators of the first successful turbofan engines.

KNOWLEDGE CIRCA 1945

Theory – To describe the shape of a wing, engineers distinguish between planform (outline of the wing viewed from above) and airfoil (shape of a fore-and-aft section). Though taking account of planform at supersonic speeds was just beginning in the mid-1940s, methods for calculating two-dimensional (i. e., planar) supersonic flow over airfoils seen as sections of a constant-chord wing of infinite span had been available for some time. The physical and mathematical principles went back to the nineteenth century, and the groundwork for aerodynamic applications had been set down in papers by Ludwig Prandtl, Theodore von Karman, and Adolf Busemann at the landmark Volta conference on “High Speed in Aviation” at Rome in 1935.3 Even at that early stage, results for the supersonic flow around a sharp-nosed airfoil could be obtained with a degree of rigor unusual for the nonlinear equations of gas dynamics.

Подпись: Shock waves

The method has its basis in the special properties of supersonic flow. In such flows generally, a pressure signal moves past a point at the speed of sound relative to the local flow at that point. As a consequence, and in contrast to the situation in subsonic flow, a signal cannot propagate upstream, and the flow at a point on an airfoil surface cannot be affected by the shape of the airfoil aft of that point. Flow along the surface can therefore be calculated stepwise from the leading to the trailing edge, taking into consideration only the flow ahead of the point in question. With only very weak approximation, the method reduces in practice to sequential application of known nonlinear relationships for two flow situations (fig. 1): (a) discontinuous compression through a shock wave, used to find conditions at the point immediately behind the sharp concave turn at the leading edge, and (b) continuous expansion through a distributed fan-like field, to calculate flow properties along the convex surface of the airfoil. The latter relationship exists by

KNOWLEDGE CIRCA 1945

Figure 1. Supersonic flow over biconvex airfoil.

virtue of the simplicity of planar flow. (The Mach lines in the expansion fan of figure 1 show the limited, rearward-growing region of influence of representative points on the airfoil’s surface.) For more rapid calculation, this nonlinear “shock – expansion” method can be approximated by a linear (or first-order) theory initiated by Jacob Ackeret in 19254 or by a more accurate second-order theory put forward by Busemann in his paper at the Volta conference. By 1946, the various methods had been used to calculate the performance of a variety of airfoils.

The foregoing theories all depend on the assumption of a fictitious inviscid gas, that is, a gas lacking the viscosity present in real gases. They thus omit viscous forces and deal only with pressure forces. Such theories had long been supplemented at subsonic speeds by Prandtl’s boundary-layer theory of 1903, which deals specifically with the ffictionally retarded viscous layer that forms close to a surface in a real gas.5 On this basis, a large body of subsonic experience had been accumulated with both quantitative calculation and qualitative thinking regarding viscous effects. At supersonic speeds, little such experience was available, though indications existed that the presence of shock waves might lead to new kinds of viscous phenomena.

Experiment – Supersonic wind tunnels large enough for experiments in flight aerodynamics came into being in the 1930s. In a paper at the Volta conference, Jacob Ackeret described at length an impressive tunnel recently completed at the Federal Technical University in Zurich, and, in comments following the talk, Mario Gaspari of the University of Rome added details of a near copy then under construction at Guidonia, a short distance from Rome.6 (The most advanced tunnels, however, came into operation in 1939 at the German army’s laboratories at Peenemtlnde following small-scale development at the Technical University of Aachen. These tunnels were used in the design of ballistic missiles. Their existence did not become known in the United States until the end of World War II.)7 It was in the Guidonia tunnel that Antonio Ferri conducted in the late 1930s the first extensive experiments on airfoils at supersonic speeds. These tests, made on a constant – section model spanning the rectangular test section of the tunnel and thus simulating infinite span, supplied a wealth of pressure-distribution and other data on an assortment of airfoil shapes. Except for a few overall-force tests in the late 1920s and during World War II in small tunnels at the National Physical Laboratory in England,8 Ferri’s results provided the only experimental assessment of airfoil theory available at the time of the wing studies to be discussed here.

Comparison – Ferri’s findings, which were to prove useful for our Ames work, can be characterized by a figure reproduced from the latter work (fig. 2). This shows the theoretical and experimental distribution of pressure along the surface of an uncambered 10-percent-thick biconvex airfoil at a free-stream Mach number M0 of 2.13 and an angle of attack a of 10 degrees. (The Mach number M at a point in a flow is the ratio of the speed of flow to the speed of sound, both at that point.) The vertical scale in figure 2 is a dimensionless measure of the difference between the surface pressure p and the free-stream pressure p°. As is customary for airfoil work, negative values are plotted upward, positive downward, so that the area

10% THICK

KNOWLEDGE CIRCA 1945

Fig. 2. Pressure distribution on surface of biconvex airfoil. (This and subsequent figures from Vincenti, “Comparison between Theory and Experiment for Wings at Supersonic Speeds,” Report 1033 [Washington, D. C.: NACA, 1951].)

between the upper – and lower-surface values can be seen as a close measure of the overall lift. The experimental points and the shock-expansion curve are taken from Ferri’s report; linear theory was added as part of the research to be described here.

As can be seen, Ferri’s measurements for the biconvex profile showed near agreement with the shock-expansion theory over most of the airfoil, a typical finding. The higher-than-theoretical pressures over the rear 40 percent of the upper surface he attributed to interaction between the viscous boundary later and the shock wave at the airfoil’s trailing edge. The retarded air in the boundary layer apparently lacked the kinetic energy necessary to negotiate the pressure rise through the shock wave. As revealed by optical studies, the resulting readjustment of the flow found the boundary layer separating from the surface ahead of the trailing edge, with a shock wave forming a short distance above the surface at the location of the separation and a more or less constant surface pressure from there to the trailing edge; a second shock wave formed outside the separated region at about the latter location. Because of the unpredictedly high pressures on the upper surface in the separated region, measured overall lift on the airfoil was less than calculated from the theory. Fern’s results thus brought to light one of the new viscous phenomena characteristic of supersonic flow. They also illustrate how theory and experiment are frequently used together to understand phenomena that are (a) ruled out of the theory by the assumptions that make it mathematically feasible but (b) would be difficult to comprehend without the theory for comparison. The relevance of the linear theory, which Ferri did not concern himself with, will become apparent later.

THE PRANDTL CORRECTION

Ludwig Prandtl’s laboratory at Gottingen did not participate in this large “international” project. Nevertheless, Prandtl’s theory of interference effects played a crucial role. The British learned about it from the report of the French tests for the International Trials.38 Compared with British results, the French results gave lower values for lift coefficients but close values for drag coefficients and the center of pressure. More importantly, the report revealed that the French used very different testing procedures from the British, particularly in their employment of the Prandtl correction for the aerodynamic interference due to wind tunnel walls.

The Prandtl correction derived from Prandtl’s concept of the trailing vortex.39 Prandtl’s aerodynamic theory posited that the lift of the airplane was due to the circulation of the air flow around its wings. This airflow produced trailing vortices, which stretched out behind the tips of the wings. These vortices, in turn, produced “induced drag,” which retarded the movement of the airfoil through the air stream. Inside a closed space like a wind tunnel, these trailing vortices were more deformed and more condensed than in the open air because of the existence of the tunnel wall. Prandtl’s theory could derive the effect of their deformation and quantitatively determine the difference in induced drag in full-scale and small-scale testing. All these theoretical discussions were then being introduced to the British aeronautical community through Glauert’s technical reports.40

In their report, the French gave results without this theoretical correction, since they had been requested to do so for the purpose of comparison with the results of other laboratories. But the French representatives emphatically recommended use of the Prandtl correction, stating that its application to raw data was a normal procedure for all their tests, especially for those made for aircraft constructors.41 In its conclusion, this interim report gave the results to which the Prandtl correction had been applied. The application of the Prandtl correction did not necessarily give uniformly better agreement between the French and the British results nor between the two French results, but it gave an agreement between the two French results on lift coefficient.

The French investigators’ confident reliance on the Prandtl correction surprised the British. In March 1923, after this report was prepared, ARC Secretary Nayler and another British official, R. J. Goodman Crouch, were sent to the French laboratories at St. Cyr and Auteuil. Both of them discussed with French representatives the Prandtl correction as well as French methods of testing in general. The representatives of both laboratories told Nayler that they considered the Prandtl correction very accurate and hoped to see the comparison between the British and the French testing results after the Prandtl correction was applied.42 Another French engineer told Crouch that the French had compared the results at the Gottingen laboratory with their own by constructing and using models of the size given in German reports, and that the results of this comparison conformed closely.

With all this information, Crouch suggested in his report to the Aerodynamics subcommittee that these test results should be reported to the Main Committee so that they could again discuss the possibility of the Gottingen laboratory participating in the International Trials.43 The report encouraged the investigators at Famborough to recommend strongly the adoption of Prandtl’s theory. In discussions at meetings of the Design Panel, the Aerodynamics subcommittee, and the Main Committee, Wood and Glauert argued for the use of the Prandtl correction and of his theory in general. However, they were still unable to persuade their British colleagues.

OUT OF CONTROL

United Airlines flight 232 was 37,000 feet above Iowa traveling at 270 knots on 19 July 1989, when, according to the NTSB report, the flightcrew heard an explosion and felt the plane vibrate and shutter. From instruments, the crew of the DC-10-10 carrying 285 passengers could see that the number 2, tail-mounted engine, was no longer delivering power (see figure 5). The captain, A1 Haynes, ordered the engine shutdown checklist, and first officer Bill Records reported first that the airplane’s

OUT OF CONTROL

Figure 5. DC-10 Engine Arrangement. Source: National Transportation Safety Board, Aircraft Accident Report, United Airlines Flight 232, McDonnell Douglas DC-10-10, Sioux Gateway Airport, Sioux City, Iowa, July 19, 1989, p. 2, figure 1. Hereafter, NTSB-232.

normal hydraulic systems gauges had just gone to zero. Worse, he notified the captain that the airplane was no longer controllable as it slid into a descending right turn. Even massive yoke movements were futile as the plane reached 38 degrees of right roll. It was about to flip on its back. Pulling power completely off the number 1 engine, Haynes jammed the number three throttle (right wing engine) to the firewall, and the plane began to level off. “I have been asked,” Haynes later wrote, “how we thought to do that; I do not have the foggiest idea.”28 No simulation training, no manual, and no airline publication had ever contemplated a triple hydraulic failure;29 understanding how it could have happened became the centerpiece of an extraordinarily detailed investigation, one that, like the inquiry into the crash of Air Florida 90, surfaced the irresolvable tension between a search for a localized, procedural error and fault lines embedded in a wide array of industries, design philosophies, and regulations.

At 15:20, the DC-10 crew radioed Minneapolis Air Route Traffic Control Center declaring an emergency and requesting vectors to the nearest airport.30 Flying in a first class passenger seat was Dennis Fitch, a training check airman on the DC-10, who identified himself to a flight attendant, and volunteered to help in the cockpit. At 15:29 Fitch joined the team, where Haynes simply told him: “We don’t have any controls.” Haynes then sent Fitch back into the cabin to see what external damage, if any, he could see through the windows. Meanwhile, second officer Dudley Dvorak was trying over the radio to get San Francisco United Airlines Maintenance to help, but without much success: “He’s not telling me anything.” Haynes answered, “We’re not gonna make the runway fellas.” What Fitch had to say on his return was also not good: “Your inboard ailerons are sticking up,” presumably held up by aerodynamic forces alone, and the spoilers were down and locked. With flight attendants securing the cabin at 1532:02, the captain said, “They better hurry we’re gonna have to ditch.” Under the captain’s instruction, Fitch began manipulating the throttles to steer the airplane and keep it upright.31

Now it was time to experiment. Asking Fitch to maintain a 10-15° turn, the crew began to calculate speeds for a no-flap, no-slat landing. But the flight engineer’s response – 200 knots for clean maneuvering speed – was a parameter, not a procedure. Their DC-10-10 had departed from its very status as an airplane. It was an object lacking even ailerons, the fundamental flight controls that were, in the eyes of many historians of flight, Orville and Wilbur Wright’s single most important innovation. And that wasn’t all: flight 232 had no slats, no flaps, no elevators, no breaks. Haynes was now in command of an odd, unproven hybrid, half airplane and half lunar lander, controlling motion through differential thrust. Among other difficulties, the airplane was oscillating longitudinally with a period of40-60 seconds. In normal flight the plane will follow such long-period swings, accelerating on the downswing, picking up speed and lift, then rising with slowing airspeed. But in normal flight, these variations in pitch (phugoids) naturally damp out around the equilibrium position defined by the elevator trim. Here, however, the thrust of the numbers one and three engines which were below the center of gravity had no compensating force above the center of gravity (since the tail-mounted number two engine was now dead and gone). These phugoids could only be damped by a difficult and counter-intuitive out-of-phase application of power on the

OUT OF CONTROL

Figure 6. Ground Track of Flight 232. Source: NTSB-232, p. 4, figure 2.

downswing and, even more distressingly, throttling down on the slowing part of the cycle.32 At the same time, the throttles had become the only means of controlling airspeed, vertical speed, and direction: the flight wandered over several hundred miles as the crew began to sort out how they would attempt a landing (see figure 6).

To a flight attendant, Haynes explained that he expected to make a forced landing, allowed that he was not at all sure of the outcome, and that he expected serious difficulty in evacuating the airplane. His instructions were brief: on his words, “brace, brace, brace,” passengers and attendants should ready themselves for impact. At 15:51 Air Traffic Controller Kevin Bauchman radioed flight 232 requesting a wide turn to the left to enter onto the final approach for runway 31 – and to keep the quasi-controllable 370,000 pound plane clear of Sioux City itself. However difficult control was, Haynes concurred: “Whatever you do, keep us away from the city.” Then, at 15:53 the crew told the passengers they had about four minutes before the landing. By 15:58 it became clear their original plan to land on the 9,000 foot runway 31 would not happen, though they could make the closed runway 22. Scurrying to redeploy the emergency equipment that were lined up on 22 – directly in the landing path of the quickly approaching jet-Air Traffic Control began to order their last scramble, as tower controller Bauchman told them: “That’ll work sir, we’re gettin’ the equipment off the runway, they’ll line up for that one.” Runway 22 was only 6,600 feet long, but terminated in a field. It was the only runway they would have a chance to make and there would only be one chance. At

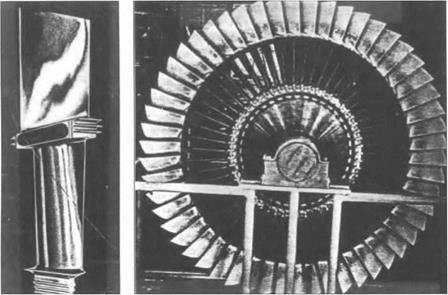
Подпись: Slage t fan rotor dtsk Figure 7. Fan Rotor Assembly. Source: NTSB Report,p. 9, figure 5.

1559:44 the ground proximity warning came on… then Haynes called for the throttles to be closed, to which check airman Fitch responded “nah I can’t pull ‘em off or we’ll lose it that’s what’s turnin’ ya.” Four seconds later, the first officer began calling out “left A1 [Haynes]” “left throttle,” “left,” “left,” left.” As they plunged towards the runway, the right wing dipped and the nose dropped. Impact was at 1600:16 as the plane’s right wing tip, then the right main landing gear, slammed into the concrete. Cartwheeling and igniting, the main body of the fuselage lodged in a com field to the west of runway 17/35, and began to bum. The crew compartment and forward side of the fuselage settled east of mnway 17/35. Within a few seconds, some passengers were walking, dazed and hurt, down mnway 17, others gathered themselves up in the midst of seven-foot com stalks, disoriented and lost. A powerful fire began to bum along the exterior of the fuselage fragment, and emergency personnel launched an all-out barrage of foam on the center section as surviving passengers emerged. One passenger went back into the burning wreckage to pull out a crying infant. As for the crew, for over thirty-five minutes they lay wedged in a waist-high cmmpled remnant of the cockpit – rescue crews who saw the airplane fragment assumed anyone inside was dead. When he regained consciousness, Fitch was saying something was cmshing his chest, dirt was in the fragmented cockpit. Second officer Dvorak found some loose insulation which he waved out a hole in the aluminum to attract attention. Finally, pried loose, emergency personnel brought the four injured crewmembers (Haynes, Records, Dvorak, and Fitch) to the local hospital.33 Despite the loss of over a hundred lives, it was, in the view of many pilots, the single most impressive piece of airmanship ever recorded. Without any functional control surface, the crew saved 185 of the 296 passengers on flight 232.

OUT OF CONTROL

Figure 8. Planform Elevator Hydraulics. Source: NTSB-232, p. 34, figure 14.

From the start, the search for probable cause centered on the number 2 (tail – mounted) engine. Not only had the crew witnessed the destruction wrought at the tail end of the plane, but Sioux City residents had photographed the damaged plane as it neared the airport; the missing conical section of the tail was immortalized in photographs. And the stage 1 fan (see figure 7), conspicuously missing from the number 2 engine after the crash, was almost immediately a prime suspect. It became, in its own right, an object of localized, historical inquiry.

From records, the NTSB determined that this particular item was brought into the General Electric Aircraft Engines facility between 3 September and 11 December 1971. Once General Electric had mounted the titanium fan disk in an engine, they shipped it to the Douglas Aircraft Company on 22 January 1972 where it began life on a new DC-10-10. For seventeen years, the stage 1 fan worked flawlessly, passing six fluorescent penetrant inspections, clocking 41,009 engine-on hours and surviving 15,503 cycles (a cycle is a takeoff and landing).34 But the fan did fail on the afternoon of 19 July 1989, and the results were catastrophic. When the tail engine tore itself apart, one hydraulic system was lost. With tell-tale traces of titanium, shrapnel-like fan blades left their distinctive marks on the empennage (see figure 8). Worst of all, the flying titanium severed the two remaining hydraulic lines.

With this damage, what seemed an impossible circumstance had come to pass: in a flash, all three hydraulic systems were gone. This occurred despite the fact that each of the three independent systems was powered by its own engine. Moreover, each system had a primary and backup pump, and the whole system was further backstopped by an air-powered pump powered by the slipstream. Designers even physically isolated the hydraulic lines one from the other.35 And again, as in the Air Florida 90 accident, the investigators wanted to push back and localize the causal structure. In Flight 90, the NTSB passed from the determination that there was low thrust to why there was low thrust to why the captain had failed to command more thrust. Now they wanted to pass from the fact that the stage 1 fan disk had disintegrated to why it had blown apart, and eventually to how the faulty fan disk could have been in the plane that day.

Three months after the accident, in October of 1989, a farmer found two pieces of the stage 1 fan disk in his com fields outside Alta, Iowa. Investigators judged from the picture reproduced here that about one third of the disk had separated, with one fracture line extending radially and the other along a more circumferential path. (See figure 9.)

Upon analysis, the near-radial fracture appeared to originate in a pre-existing fatigue region in the disk bore. Probing deeper, fractographic, metallographic and chemical analysis showed that this pre-existing fault could be tracked back to a metal “error” that showed itself in a tiny cavity only 0.055 inches in axial length and 0.015 inches in radial depth: about the size of a slightly deformed period at the end of this typed sentence. Titanium alloys have two crystalline structures, alpha and beta, with a transformation temperature above which the alpha transforms into beta. By adding impurities or alloying elements, the allotropic temperature could be lowered to the point where the beta phase would be present even at room temperature. One such alloy, ТІ-6А1-4У was known to be hard, very strong, and was expected to maintain its strength up to 600 degrees Fahrenheit. Within normal ТІ-6А1-4У titanium, the two microscopic crystal structures should be present in about equal quantities. But inside the tiny cavity buried in the fan disk lay traces of a “hard alpha inclusion” titanium with a flaw-a small volume of pure alpha-type crystal structure, and an elevated hardness due to the presence of (contaminating) nitrogen.36

Putting the myriad of the many other necessary causes for the accident aside, the gaze of the NTSB investigators focused on the failed titanium, and even more closely on the tiny cavity with its traces of an alpha inclusion. What caused the alpha inclusion? There were, according to the investigation, three main steps in the production of titanium-alloy fan disks. First, foundry workers melted the various materials together in a “heat” or heats after which they poured the mix into a titanium alloy ingot. Second, the manufacturer stretched and reduced the ingot into “billets” that cutters could slice into smaller pieces (“blanks”). Finally, in the third and last stage of titanium production, machinists worked the blank into the appropriate geometrical shapes – the blanks could later be machined into final form.

Hard alpha inclusions were just one of the problems that titanium producers and consumers had known about for years (there were also high-density inclusions, and

OUT OF CONTROL

Figure 9. Stage 1 Fan Disk (Reconstruction).Source: UAL 232 Docket, figure 1.10.2

the segregation of the alloy into flecks). To minimize the hard alpha inclusions, manufacturers had established various protective measures. They could melt the alloy components at higher heats, they could maintain the melt for a longer time, or they could conduct successive melting operations. But none of these methods offered (so to speak) an iron-clad guarantee that they would be able to weed out the impurities introduced by inadequately cleaned cutting, or sloppy welding residues. Nor could the multiple heats absolutely remove contamination from leakage into the furnace or even items dropped into the molten metal. Still, in 1970-71, General Electric was sufficiently worried about the disintegration of rotating engine parts that they ratcheted up the quality control on titanium fan rotor disks – after January 1972, the company demanded that only triple-vacuum-melted forgings be used. The last batch of alloy melted under the old, less stringent (double-melt) regime was Titanium Metals Corporation heat K8283 of February 23, 1971. Out of this heat, ALCOA drew the metal that eventually landed in the stage 1 fan rotor disk for flight 232.37

Chairman James Kolstad’s NTSB investigative team followed the metal, finding that the 7,000 pound ingot K8283 was shipped to Ohio for forging into billets of 16м diameter; then to ALCOA in Cleveland, Ohio, for cutting into 700 pound blanks; the blanks then passed to General Electric for manufacture. These 16м billets were tested with an ultrasonic probe. At General Electric, samples from the billet were tested numerous ways and for different qualities – tensile strength, microstructure, alpha phase content and amount of hydrogen. And, after being cut into its rectilinear machine-forged shape, the disk-to-be again passed an ultrasonic inquisition, this time by the more sensitive means of immersing the part in liquid. The ultrasonic test probed the rectilinear form’s interior for cracks or cavities, and it was supplemented by a chemical etching that aimed to reveal surface anomalies.38 Everything checked, and the fan was then machined and shot peened (that is, hammered smooth with a stream of metal shot) into its final form. On completion, the now finished disk fan passed a fluorescent penetrant examination – also designed to display surface cracking.39 It was somewhere at this stage – under the stresses of final machining and shot peening – that the investigators concluded cracking began around the hard alpha inclusion. But since no ultrasonic tests were conducted on the interior of the fan disk after the mechanical stresses of final machining, the tiny cavity remained undetected.^

The fan’s trials were not over, however, as the operator – United Airlines – would, from then on out, be required to monitor the fan for surface cracking. Protocol demanded that every time that maintenance workers disassembled part of the fan, they were to remove the disk, hang it on a steel cable, paint it with fluorescent penetrant, and inspect it with a 125-amp ultraviolet lamp. Six times over the disk’s lifetime, United Airlines personnel did the fluorescence check, and each time the fan passed. Indeed, by looking at the accident stage-1 fan parts, the Safety Board found that there were approximately the same number of major striations in the material pointing to the cavity as the plane had had cycles (15, 503). This led them to conclude that the fatigue crack had begun to grow more or less at the very beginning of the engine’s life. Then (so the fractographic argument went) with each takeoff and landing the crack began to grow, slowly, inexorably,

OUT OF CONTROL

Figure 10. Cavity and Fatigue Crack Area. Source: NTSB-232, p. 46, figure 19B.

out from the 1/100" cavity surrounding the alpha inclusion, over the next 18 years. (See figure 10.)

By the final flight of 232 on 19 July 1989, both General Electric and the Safety Board believed the crack at the surface of the bore was almost fi" long.41 This finding exonerated the titanium producers, since interior faults, especially one with no actual cavity, were much harder to find. It almost exonerated General Electric because their ultrasonic test would not have registered such an interior filled cavity with no cracks, and their etching test was performed before the fan had been machined to its final shape. By contrast, the NTSB laid the blame squarely on the United Airlines San Francisco maintenance team. In particular, the report aimed its cross hairs on the inspector who last had the fan on the wire in February 1988 for the Fluorescent Penetrant Inspection. At that time, 760 cycles before the fan disk disintegrated, the Safety Board judged that the surface crack would have grown to almost fi". They asked: why didn’t the inspector see the crack glowing under the illumination of the ultraviolet lamp?42 The drive to localization had reached its target. We see in our mind’s eye an inculpatory snapshot: the suspended disk, the inspector turning away, the half-inch glowing crack unobserved.

United Airlines’ engineers argued that stresses induced by rotation could have closed the crack, or perhaps the shot peening process had hammered it shut,

preventing the fluorescent dye from entering.43 The NTSB were not impressed by that defense, and insisted that the fluorescent test was valid. After all, chemical analysis had shown penetrant dye inside the half-inch crack found in the recovered fan disk, which meant it had penetrated the crack. So again: why didn’t the inspector see it? The NTSB mused: the bore area rarely produces cracks, so perhaps the inspector failed to look intently where he did not expect to find anything. Or perhaps the crack was obscured by powder used in the testing process. Or perhaps the inspector had neglected to rotate the disk far enough around the cable to coat and inspect all its parts. Once again, a technological failure became a “human factor” at the root of an accident, and the “performance of the inspector” became the central issue. True, the Safety Board allowed that the UA maintenance program was otherwise “comprehensive” and “based on industry standards.” But non-destructive inspection experts had little supervision and not much redundancy. The CRM equivalent conclusion was that “a second pair of eyes” was needed (to ensure advocacy and inquiry). For just this reason the NTSB had come down hard on human factors in the inspection program that had failed to find the flaws leading to the Aloha Airlines accident in April 1988.44 Here then was the NTSB-certified source of flight 232’s demise: a tiny misfiring in the microstructure of a titanium ingot, a violated inspection procedure, a humanly-erring inspector. And, once again, the NTSB produced a single cause, a single agent, a violated protocol in a fatal moment.45

But everywhere the report’s trajectory towards local causation clashes with its equally powerful draw towards the many branches of necessary causation; in a sense, the report unstably disassembled its own conclusion. There were safety valves that could have been installed to prevent the total loss of hydraulic liquid, screens that would have slowed its leakage. Engineers could have designed hydraulic lines that would have set the tubes further from one another, or devised better shielding to minimize the damage from “liberated” rotating parts. There were other ways to have produced the titanium – as, for example, the triple-vacuum heating (designed to melt away hard alpha defects) that went into effect mere weeks after the fateful heat number 8283. Would flight 232 have proceeded uneventfully if the triple-vacuum heating had been implemented just one batch earlier? There are other diagnostic tests that could have been applied, including the very same immersion ultrasound that GEAE used – but applied to the final machine part. After all, the NTSB report itself noted that other companies were using final shape macroetching in 1971, and the NTSB also contended that a final shape macroetching would have caught the problem.46 Any list of necessary causes – and one could continue to list them ad libidum – ramified in all directions, and with this dispersion came an ever-widening net of agency. For example, in a section labeled “Philosophy of Engine/Airframe Design,” the NTSB registered that in retrospect design and certification procedures should have “better protected the critical hydraulic systems” from flying debris. Such a judgment immediately dispersed both agency and causality onto the entire airframe, engine, and regulatory apparatus that created the control mechanism for the airplane.47

At an even broader level of criticism, the Airplane Pilots Association criticized the very basis of the “extremely improbable design philosophy” of the FAA. This “philosophy” was laid out in the FAA’s Advisory Circular 25.1309-1A of 21 June 1988, and displayed graphically in its “Probability versus Consequence” graph (figure 11) for aircraft system design.48 Not surprisingly, the FAA figured that catastrophic failures ought to be “extremely improbable,” (by which they meant less likely than one in a billion) while nuisances and abnormal procedures could be “probable” (1 in a hundred thousand). Recognizing that component failure rates were not easy to render numerically precise, the FAA explained that this was why they had drawn a wide line on figure 11, and why they added ‘The expression ‘on the order of when describing quantitative assessments.”49 A triple hydraulic failure was supposed to lie squarely in the one in a billion range – essentially so unlikely that nothing in further design, protection, or flight training would be needed to counter it. The pilots union disagreed. For the pilots, the FAA was missing the boat when it argued that the assessment of failure should be “so straightforward and readily obvious that… any knowledgeable, experienced person would unequivocally conclude that the failure mode simply would not occur, unless it is associated with a wholly unrelated failure condition that would itself be catastrophic.” For as they pointed out, a crash like that of 232 was precisely a catastrophic failure in one place (the engine) causing one in another (the flight control system). So while the hydraulic system might well be straightforwardly and obviously proof against independent failure, a piece of flying titanium could knock it out even if all three levels of pumps were churning away successfully. Such externally induced failures of the hydraulic system had, they pointed out, already occurred in a DC-10 (Air Florida), a 747 (Japan Air Lines) and an L-1011 (Eastern). “One in a billion” failures might be so in a make-believe world where hydraulic systems flew by themselves. But they don’t. Specifically, the pilots wanted a control system that was completely independent of the hydraulics. More generally, the pilots questioned the procedure of risk assessment. Hydraulic systems do not fly alone, and because they don’t, any account of causality and agency must move away from the local and into the vastly more complex world of systems interacting with systems.50 The NTSB report – or more precisely one impulse of the NTSB report – concurred: “The Safety Board believes that the engine manufacturer should provide accurate data for future designs that would allow for a total safety assessment of the airplane as a whole.”51 But a countervailing impulse pressed agency and cause into the particular and localized.

When I say that instability lay within the NTSB report it is all this, and more. For contained in the conclusions to the investigation of United 232 was a dissenting opinion by Jim Burnett, one of the lead investigators. Unlike the majority, Burnett saw General Electric, Douglas Aircraft and the Federal Aviation Agency as equally responsible.

I think that the event which resulted in this accident was foreseeable, even though remote, and that neither Douglas nor the FAA was entitled to dismiss a possible rotor failure as remote when reason­able and feasible steps could have been taken to “minimize” damage in the event of engine rotor failure. That additional steps could have been taken is evidenced by the corrections readily made, even as retrofits, subsequent to the occurrence of the “remote” event.52

OUT OF CONTROL
OUT OF CONTROL

Figure 11. Probability Versus Consequence. Source: UAL 232 Docket, U. S. Department of Transportation, Federal Aviation Administration, “System Design and Analysis,” 6/21/88, AC No. 25.1309-1 A, fiche 7, p. 7.

Like a magnetic force from a needle’s point, the historical narrative finds itself drawn to condense cause into a tiny space-time volume. But the narrative is constantly broken, undermined, derailed by causal arrows pointing elsewhere, more globally towards aircraft design, the effects of systems on systems, towards risk – assessment philosophy in the FAA itself. In this case that objection is not implicit but explicit, and it is drawn and printed in the conclusion of the report itself.

Along these same lines, I would like, finally, to return to the issue of pilot skill and CRM that we examined in the aftermath of Air Florida 90. Here, as I already indicated, the consensus of the community was that Haynes, Fitch, Dvorak, and Records did an extraordinary job in bringing the crippled DC-10 down to the threshold of Sioux City’s runway 22. But it is worth considering how the NTSB made the determination that they were not, in fact, contributors to the final crash landing of Flight 232. After the accident, simulators were set up to mimic a total, triple hydraulic failure of all control surfaces of the DC-10. Production test pilots were brought in, as were line DC-10 pilots; the results were that flying a machine in
that state was simply impossible, the skills required to manipulate power on the engines in such a way as to control simultaneously the phugoid oscillations, airspeed, pitch, descent rate, direction, and roll were quite simply “not trainable.” While individual features could be learned, “landing at a predetermined point and airspeed on a runway was a highly random event”53 and the NTSB concluded that “training… would not help the crew in successfully handling this problem. Therefore, the Safety Board concluded that the damaged airplane, although flyable, could not have been successfully landed on a runway with the loss of all hydraulic flight controls.” “[U]nder the circumstances,” the Safety Board concluded, “the UA flightcrew performance was highly commendable, and greatly exceeded reasonable expectations.”54 Haynes himself gave great credit to his CRM training, saying it was “the best preparation we had.”55

While no one doubted that flight 232 was an extraordinary piece of flying, not everyone concurred that CRM ought take the credit. Buck, ever dissenting from the CRM catechism, wrote that he would wager, whatever Haynes’s view subsequently was, that Haynes had the experience to handle the emergency of 232 with or without the aid of earthbound psychologists.56 But beyond the particular validity of cockpit resource management, the reasoning behind the NTSB satisfaction with the flightcrew is worth reviewing. For again, the Safety Board used post hoc simulations to evaluate performance. In the Air Florida Flight 90, the conclusion was that the captain could have aborted the takeoff safely, and so he was condemned for not aborting; because the simulator pilots could fly out of the stall by powering up quickly, the captain was damned for not having done so. In the case of flight 232, because the simulator-flying pilots were not able to land safely consistently, the crew was lauded. Historical re-enactments were used differently, but in both cases functioned to confirm the localization of cause and agency.

Rolls-Royce – Compressor Bleed

Rolls-Royce initially adopted still a third approach to solving the high pressure-ratio compressor problem. After experimenting with variable stator vanes, they elected to employ only variable inlet guide vanes, bleeding off flow from the middle stages of the compressor during off-design operation in order to limit the flow entering the rear stages. The principal engine produced with this approach, the Avon, went through several versions. The 16-stage compressor in one version produced an overall pressure-ratio of 8.5 to 1 (for an average pressure-ratio of 1.14 per stage), while a later version produced a pressure-ratio of 10 to 1 (for an average of 1.15 per stage).26 Commercial versions of the Avon powered the ill-fated Comet and the highly successful Caravelle.

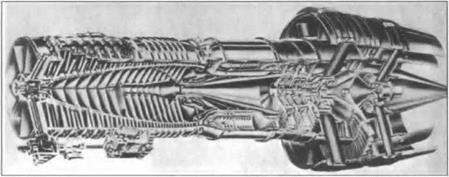
In the early 1950s Rolls-Royce developed a new, larger engine, the Conway, that solved the compressor problem in a new way. The Conway, shown in Figure 7, was a two-spool engine, with 6 stages in its low-pressure compressor and 9 stages in its high-pressure compressor. Its overall pressure-ratio was 12 to 1 (for an average pressure-ratio of 1.18 per stage). Like the Avon, the Conway had flow bled off from the middle of the compressor in order not to overload the rear stages. In the Conway, however, the flow bled off from the tip of the low-pressure compressor became bypass flow, adding to the thrust of the engine, in essentially the same manner as in the De Havilland engine from the 1940s discussed earlier. The Conway thereby became the first bypass engine to enter flight service, operating at a bypass ratio of 0.6 – i. e. three-eighths of the total flow bypassed the gas generator. The bypass flow accomplished three things: (1) it provided cooling of the gas generator casing; (2) its lower exhaust velocity reduced exhaust noise, which was becoming an increasing concern in commercial aviation; and (3) it

Rolls-Royce - Compressor Bleed

Figure 7. Rolls Royce Conway bypass engine RC03, early 1950s. First bypass engine to enter service. Note bypass of cool, compressed air around remainder of gas generator. [Wilde, cited in text.]

improved overall propulsion efficiency, gaining more thrust per unit fuel. Rolls tended to emphasize the first two of these in their efforts to sell the Conway, for the bypass ratio was too small to produce a dramatic improvement in propulsion efficiency. Nevertheless, the improvement was there. Scaled-up versions of the Conway, producing more than 17,000 pounds of thrust, powered some of the advanced 707s27 and DC-8s, as well as the Vickers VC-10.

Pointing to the arbitrariness of restricting the designation “fan” to no more than 2 or 3 stages, Rolls-Royce has long argued that the Conway has claim to being at least the immediate progenitor of the turbofan engines that entered service in the early 1960s, if not the first turbofan.28 This underscores the futility of worrying about firsts here. The more important question is how the Conway fit into the evolutionary development of the turbofan. Over time, a sequence of incremental advances to the Conway in “normal design” might well have reduced the number of low-compressor stages pressurizing the bypass flow and increased the bypass ratio, resulting in an engine little different from P&W’s first turbofans. This “gradualist” evolution, however, is a history that might have been, not what happened. The turbofan engines that entered service in the early 1960s and established the turbofan’s dominant place in aviation did not evolve from the Conway, but instead emerged along a very different sort of pathway.

GENERATING NEW KNOWLEDGE, 1946-1948

With the end of the war, research on supersonic aerodynamics, both theoretical and experimental, began in earnest. Despite the daunting uncertainties of flight through the speed of sound – “breaking the sound barrier” in the popular terminology – the newly available jet and rocket engines made supersonic flight at least imaginable. A feeling prevailed among research managers and research workers alike that the time had come for serious study of supersonic problems. My own work at Ames in the period discussed here was in the new 1- by З-ft Supersonic Wind Tunnel Section, where I engaged primarily in wind-tunnel experiments and in comparison between experiment and theory. At the same time, a great deal of theoretical work was going on in other parts of the laboratory. I shall discuss our group’s activities under the same headings as before.

Theory – To design supersonic aircraft, airfoil theory, however accurate, would hardly be sufficient; actual airplanes have finite-span wings. Because of the three­dimensional complexity of such problems, little could be hoped for here beyond a linear theory, which in effect assumes small disturbances from the free stream and hence thin wings at small angles of attack. Fortunately, physical concepts and mathematical tools for such linear approximation had long been established from study of acoustic phenomena and the associated wave equation. With potential utility as motivation, a vast three-dimensional extension of Ackeret’s two­dimensional linear theory of 1925 appeared in the last half of the 1940’s. In this rapid growth, duplication was inevitable within and between aeronautically advanced countries. Here I deal only with work having direct bearing on our study at Ames.

Initial influence on our thinking came from the findings of Robert Jones of the NACA and Allen Puckett of the California Institute of Technology. Jones, working at the NACA’s Langley Aeronautical Laboratory in Virginia and using a linear approach of his own devising, was first in the United States to conceive (in early 1945) of the beneficial effects of wing sweepback at high speeds. He continued to elaborate his exciting and original ideas at Langley and after moving to Ames in August 1946. Puckett, working at about the same time, used a method employed on bodies of revolution in the early 1930’s by Theodore von Karman and his Caltech student Norton Moore. At Karman’s suggestion, Puckett extended this method to the zero-lift drag of triangular wings, with special attention to the influence of the sweepback angle of the leading edge and the chordwise location of maximum thickness. His results attracted considerable notice when presented at an aeronautical meeting in New York in January of 1946. Developments such as these could not help but catch the attention of the Ames Theoretical Aerodynamics Section under Max. Heaslet; and he, Harvard Lomax, and their coworkers were soon adding to the flood of linear theory. A body of potentially useful theory was thus appearing just as experimental work was beginning in earnest.9

Qualitative concepts from the linear theory are important for our later comparisons. Figure 3 concerns the behavior of three flat lifting surfaces of representative planform (such surfaces being sufficient for our general points). Instead of propagating upstream and throughout the field as in subsonic flow, the pressure signal from a disturbance in a supersonic flow is confined, in the linear approximation, to the interior of a “Mach cone” – a circular cone with axis aligned with the free stream and apex angle a decreasing function of the free-stream Mach number M0. In the figure, the trace of significant Mach cones in the plane of the lifting surfaces at a fixed M° is shown by the dashed lines. We see that the effect of the tips on the straight wing A is confined to small triangular regions beginning at the leading edge. The remaining, dotted region of the wing is, so to speak, unaware

GENERATING NEW KNOWLEDGE, 1946-1948

Fig 3. Flat lifting surfaces in supersonic flow according to linear theory.

of the presence of the tips, and has the constant fore-and-aft lift distribution characteristic of two-dimensional flow (compare, for example, the uniform vertical distance between the linear-theory curves for the upper and lower surfaces in figure 2). On the moderately swept wing В in the figure, the additional effect of the wing root is, like that of the tips, confined to a finite region aft of the leading edge. It turns out that the flow in the dotted region is again effectively two-dimensional and the lift distribution correspondingly constant. The highly swept wing – has its leading edge entirely within the region of influence of the wing root, and no regions of two­dimensional flow exist. Interestingly, the lift distribution here turns out to be similar in its general features to that given by linear theory in two-dimensional swisonic flow – infinite at the leading edge and decreasing to zero at the trailing edge. Though the linear behavior of figure 2 is approximate, there was reason to believe that the nonlinear inviscid situation would be at least qualitatively similar.

Experiment – The mid-1940s saw construction of numerous supersonic wind tunnels in the United States and other countries. The considerable and demanding complexity of supersonic as compared with subsonic tunnels can be found described elsewhere.10 The Ames supersonic tunnel, construction of which began in 1944, was a closed-return, variable-pressure facility powered by centrifugal compressors totaling 10,000 horsepower. These characteristics and its 1-foot-wide by 3-foot-high test section made it the NACA’s, and one of the country’s, first supersonic tunnels of adequate size and versatility for comprehensive aerodynamic testing. Design of the tunnel drew on findings from smaller experimental tunnels at Caltech and the NACA’s Langley Laboratory, small-scale tests of our own, and the little we knew of the tunnels at Zurich and Guidonia. (Our knowledge of these was not as great as it could have been, thanks to the limited attention given in the United States to the proceedings from the Volta conference. Existence of the more advanced tunnels at Peenemtlnde was still unknown.) I participated in design of the tunnel and was assigned supervisory responsibility for it and the activities of the 1- by З-ft Wind Tunnel Section when operation began in late 1945.11 The group, typical of a wind-tunnel staff at Ames, numbered around 35 people, of which 20 or so were research engineers.

Just as theoretical work requires mathematical techniques, experiment requires instrumentation. To measure forces on a model in the new tunnel, our group developed a new support and balance system that simplified such arrangements. This system supported a model from the rear on a slender rod (a “sting”) attached to a long, slender, fore-and-aft beam. The beam in turn was supported inside a housing that shielded it from the airstream and that could be adjusted angularly by an electric drive to change the model’s angle of attack. Motion of the beam in relation to the housing was constrained by small, stiff cantilever springs equipped with electric – resistance strain gages. These tiny gages, which had only recently been invented for structural testing, were made of a back-and-forth winding of fine wire cemented to the springs; they measured the deflections of the springs and hence the forces on them by measuring the change in electrical resistance of the wire as it was stretched by the deflection. The forces on the springs could then be used to calculate the forces on the model. It was the strain gages, in fact, that made a compact system interior to the tunnel feasible. As often happens, advance in one area of technology – structural testing – thus made possible advance in a very different one – supersonic experiment.

The wing tests in 1946-47 constituted the third and most extensive experiments thus far in the new tunnel. The move to test wings in relation to theory required approval, though hardly direction, from Ames management; with the body of theory then appearing, it was clearly the thing to do. In planning the tests, my prime concern was to explore a wide range of planforms while keeping the number of tests and accompanying theoretical calculations within doable bounds. In the end, I settled on 19 wings varying systematically in sweepback angle, taper ratio (ratio of tip chord to root chord), and aspect ratio (ratio of span to average chord). The airfoil section for most of the models was an isosceles triangle with a height of five-percent of the base (the airfoil chord). The sharp leading edge, a marked departure from the blunt edge employed for subsonic flight, was known to have advantages at supersonic speeds for platforms of moderate leading-edge sweep. The isosceles – triangle section was chosen primarily to facilitate construction, the flat bottom making for easy mounting for machining. As it turned out, the cambered section brought to light some interesting, if secondary, results that would not have been encountered with an aerodynamically simpler uncambered section. At the time of the tests, the planned adjustable wind-tunnel nozzle needed to vary M0 at supersonic speeds had not been finished, and all measurements were made in a fixed nozzle at M0 = 1.53. The free-stream Mach number for the tests was thus not a variable.

A reader of my book What Engineers Know… will recognize the scheme of testing just described as an example of the method of parameter variation, which I examined in connection with the Durand-Lesley propeller studies at Stanford University. This method can be defined in general as “the procedure of repeatedly determining the performance of some material, process, or device while systematically varying the parameters that define the object of interest or its condition of operation.”12 In the Durand-Lesley work, the variable parameters were five quantities that defined the complex shape of the propeller blades, plus two quantities – the speed of the airstream and the speed of rotation of the propeller – that defined the condition of operation. In the present tests, the geometrical parameters were the three planform quantities mentioned above (supplemented by a few individual planforms and airfoil sections); the single operational parameter was the wing’s angle of attack relative to the airstream. Engineers employ such experimental parameter variation widely to supply design data in situations where theory is unavailable, unreliable, or, for one reason or another, impractical to apply. It is also employed extensively, as here, in engineering research. The method has been used so much and for so long that it has become second nature to engineers. It had been constantly before me in my student days at Stanford in the collection of Durand-Lesley propellers mounted on the wall of the wind-tunnel laboratory; at the NACA it was embedded in the culture. I and my colleagues would never have thought of it at that time as a formal method nor felt the need to give it a name.

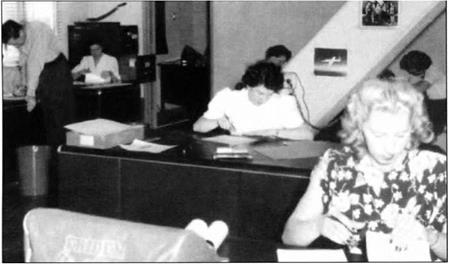
As usual in NACA wind-tunnel studies, a team of research engineers – in this case about ten – carried out the work. The team included test engineers running the experiments on a two-shift basis, a specialist responsible for the functioning of the new, still troublesome balance system, and an engineer who monitored the day-to­day reduction of the data to standard form. The numerical calculations for the last operation kept four or five young women busy operating electrically driven Friden mechanical calculators, the usual practice before the advent of electronic computers. Two additional engineers did the then difficult calculations of wing characteristics according to linear theory and analyzed the results in comparison with the experiments. The members of the team occupied the same or adjacent offices and exchanged experience and suggestions as part of their daily interaction. My own task, besides planning the research, was to oversee the operation, participate closely in the analysis, and handle much of the final reporting. Robert Jones, though not assigned formally to the l-by-3 Section after his move from Langley, occupied an office across from mine, and we talked regularly. Since few people had training in supersonic aerodynamics at that time, work such as ours tended to be a young person’s game; at 29,1 was the oldest in the Section and one of two with a graduate degree – a two-year Engineer’s degree for me and a one-year Master’s degree for the other. We learned as we went.

Though the planning had been exciting, running the tests and reducing the data were characteristically tedious. To carry out the tests, an experienced engineer operated the wind tunnel and other equipment, while a junior engineer recorded the meter readings from the strain gages. Though sitting side by side, they communicated by microphones and head sets because of the roar of the wind-tunnel compressors. The models could be seen through circular access windows in the sides of the tunnel’s test section, as was found useful for the boundary-layer observations to be described later. Two mechanical technicians prepared models for subsequent tests and took care of the trouble shooting and repair needed in those early years of the equipment’s operation. Reduction of the data by the young women required long hours of repeated calculations to fill the many columns of numbers leading to the standard forms (see below). Their supervising engineer, besides helping organize their effort, plotted the results in a uniform layout, sometimes detecting discrepancies that called for recalculation or retesting. A shared sense of purpose and the fact that there was no other way – plus a good deal of humor and give-and-take – made the tediousness of all this tolerable.

Intellectual excitement reappeared in the theoretical calculations and in the analysis of the results. The theoretical computations called for considerable mathematical skill and ingenuity in an area that was only then developing. The engineers doing the task kept in close touch with the people in the Theoretical Aerodynamics Section who were contributing to that development. As our work progressed, they made ongoing comparison, where possible, between the emerging theoretical findings and our accumulating test results. For my part, I looked in on the wind-tunnel testing when I could, making occasional suggestions. I also struggled to keep abreast of the theoretical work, especially the resulting comparisons, and once or twice a week I reviewed the accumulating data plots, looking especially for questionable results that might call for retesting. The entire activity was less rigidly organized than this account may sound, with much improvization and a great deal of back-and-forth suggestion. To keep my review of the plots from being interrupted by other duties, I regularly took refuge in an unused upstairs room, leaving instructions with my secretary that I was not to be bothered by phone calls or otherwise. When the laboratory’s director telephoned one day, she refused to put him through; the sharp reaction caused me to add an exception to my instructions.

All work in our tunnel, including the wing study, came up for discussion in Friday-aftemoon meetings between myself, the two engineers doing the theory, and the project engineers of two or three concurrent studies. These meetings led to vigorous and contentious, though friendly, debate. Although we did not think of it that way at the time, we were learning and educating each other in the complexities of supersonic aerodynamics, a field in which few people could claim broad knowledge.

I do not suggest that we were alone in the learning process. Experimental and theoretical study of supersonic flow grew rapidly at various laboratories in the period in question. In the year before the present work, researchers at the Langley Laboratory ran “preliminary” tests in their 9-by-9-inch experimental tunnel of eight triangular planforms of varying apex angle plus six sweptback wings; the lift for the triangular wings they compared with a limiting-case linear theory valid for small apex angles.13 The efforts of our team provided the first extended comparison of experimental results for symetrically related wings with calculations from the full linear theory.

Comparison – The results of the study appeared in three detailed reports (originally confidential, later declassified) in late 1947 and mid-1948.14 The plots reproduced here are taken from a later summary presentation. The sampling is a limited one, chosen to highlight the relationship of theory to experiment.

Variation of lift with angle of attack normally follows a straight line, both experimentally and theoretically, at the low angles useful in practice. Figure 4 gives the measured and theoretical slope of these lines for four unswept wings of varying aspect ratio. (Lift is the upward force perpendicular to the direction of the free stream. The quantity CL on the vertical axis is a dimensionless measure of lift.) The wings, illustrated by the sketch with each test point, had a common taper ratio of 1/2; each sketch shows the trace of the Mach cone from the forwardmost point of the wing. In this and later figures, results from linear theory were provided over as wide a range as was possible at the time.

The agreement between experiment and theory is seen to be excellent – too good, in fact, to be strictly true. The theory neglected viscosity and applied to the wing alone; the experiment took place in a viscous gas and involved aerodynamic interference from the slender body needed to support the model (illustrated later in figure 10). It seemed likely that these effects, probably small in the case of lift, just compensated for this family of wings. The theoretical reduction in lift-curve slope at

M0 = 153 EXPERIMENT

———- LINEAR THEORY (WING ALONE)

GENERATING NEW KNOWLEDGE, 1946-1948

ASPECT RATIO, A

Fig 4. Effect of aspect ratio on lift-curve slope.

low aspect ratios comes from a loss of lift within the Mach cones that originate at the leading edge of the wing tips; as the aspect ratio decreases, a greater fraction of the planform falls within these Mach cones, with resulting decrease in the calculated lifting effectiveness of the wing. The agreement of theory with experiment implied that such theoretical decrease in fact occurred.

The effect of sweep on the lift-curve slope appears in figure 5 for seven wings, also of taper ratio 1/2. The sweep angle in all cases was measured at the midchord line; the wing of 43E sweepback was chosen to have its leading edge coincident with the Mach cone at M0=1.53. A swept-forward wing in each case was obtained from the corresponding swept-back wing by reversing the model in the support body.

The theoretical results proved symmetrical about the vertical axis between ±43°. Such symmetry had been predicted analytically for certain classes of wings, though not the kind here. Shortly after our reports were written, this initially surprising “reversibility theorem” was verified with complete generality, so the theoretical curve could have been extended to -60°. The departure from symmetry in the experimental results was conjectured to be due to aeroelastic deformation, present in the experiments but absent from the theory. Such deformation increases the angle of attack of sections near the wing tips for forward portions of sweptforward wings and decreases it for rearward portions of sweptback wings;

GENERATING NEW KNOWLEDGE, 1946-1948

this difference changes the lift in opposite directions, increasing it for sweptforward wings and decreasing it for sweptback. Again, compensation of secondary effects, this aeroelastic deformation plus the two previous ones, was thought to play a role in the almost perfect agreement between experiment and theory for sweepforward.

Validity of linear theory in predicting lift must not be taken to imply validity in the prediction of lift distribution. This can be seen in the two-dimensional results of figure 2. The total lift, as indicated by the area between the upper – and lower-surface curves, is given very closely by linear theory in comparison with nonlinear shock – expansion theory, and, to a somewhat lesser degree, with experiment. The shock-expansion and experimental distributions of lift, however, are concentrated noticeably more toward the leading edge. As a consequence, the corresponding centers of lift are forward of the midchord location given by the uniform linear distribution, somewhat more so in the case of experiment thanks to the shock-wave, boundary-layer interaction near the trailing edge.

Observations of this kind helped explain the results of figure 6 for the family of unswept wings. The quantity on the vertical axis (whose strict definition is immaterial here) can be shown to be a close measure of the displacement of the center of lift forward of the geometric centroid of the planform (midchord at midspan for the present wings). Here, as a result again of the loss of lift within Mach cones (not illustrated) at the tips, which would be larger toward the trailing edge, linear theory shows a progressively forward displacement as the aspect ratio A is reduced. In the opposite direction, in the limit of infinite aspect ratio (A x 8), the tips disappear and the flow over the wing becomes entirely two­dimensional; the theoretical curve must accordingly approach the linear section value of zero (i. e., midchord, cf. fig. 2) in that limit, as indeed it appeared to do. Similarly, if a theoretical curve could be calculated over the entire range of A by a three-dimensional equivalent of the shock-expansion theory, it would have to approach (cf. again fig. 2) a limit forward of midchord; the calculated value for the present isosceles-triangle section is shown in the figure. The fact that the experimental curve appeared to be approaching an asymptote somewhat above this value was consistent with the presence of shock-wave, boundary-layer interaction as before. We inferred therefore that the departure here of experiment from linear theory for all aspect ratios (despite the agreement for overall lift) came from nonlinear pressure effects and shock-wave, boundary-layer interaction through their joint influence on chordwise lift distribution. We were here doing what engineers often find necessary – using experience from a simpler and hence more theoretically analyzable case to interpret (and sometimes

M0- 1.53 EXPERIMENT

———- LINEAR THEORY (WING ALONE)

GENERATING NEW KNOWLEDGE, 1946-1948

ASPECT RATIO, A

Fig 6. Effect of aspect ratio on position of center of lift.

GENERATING NEW KNOWLEDGE, 1946-1948

anticipate) the problems encountered in applying a necessarily more approximate theory to a more complicated case.

That even this may not be possible is illustrated by figure 7 for the center of lift of the swept wings. The unswept wing here is the aspect-ratio-4 wing of figure 6, for which the departure of experiment from theory was reconcilable as above. The complete disagreement in variation with angle of sweep, however, could not be reconciled on the basis of existing knowledge. Experimental studies of sweep at subsonic speeds had indicated major effects of viscosity on lift distribution, particularly at high sweep angles. Nonlinear pressure effects, however, could not be discounted here. Differences in elastic deformation between forward and backward sweep could also have greater influence on center of lift than on lift itself. As often happens with initial exploration into a new field, the findings here raised more questions than they answered.

Drag, the force parallel to the free stream, is influenced in a major way by viscous friction on the wing surface. Here a sampling of drag at the small angle of attack at which it is a minimum will serve our purpose. Figure 8 gives a dimensionless measure of this minimum drag for the family of swept wings. The theoretical pressure drag, like the lift-curve slope, proved symmetrical with regard to sweep

M0* 1.53 EXPERIMENT

———- LINEAR THEORY(WING ALONE)

GENERATING NEW KNOWLEDGE, 1946-1948

Fig 8. Effect of sweep on minimum drag.

angle over the range between ±43° within which drag calculations were then feasible. This was in keeping with a then recently proven theorem. The expectation (later confirmed) was that the theoretical curve, when continued, would reach its maximum for sweep in the vicinity of the Mach cone and then fall off with further sweep, again symmetrically. The experimental results showed just such overall behavior, though in view of the complexities likely to arise from viscosity and support-body interference, the near perfect symmetry here came as a surprise. The experimental – like the theoretical – fall off at high sweep, however, was expected, in keeping with Jones’s ideas and with what experimentalists were finding, by “stopgap” methods of varying accuracy, at supersonic and high subsonic speeds. With regard to viscous drag, the experimental point for zero sweep showed a reasonable increment beyond the theoretical pressure drag, tending to confirm the theory in this situation. Disappearance of this increment with increasing sweep in either direction, however, suggested that linear theory overestimates the pressure drag for sweep near the Mach cone. All we could do here was to point out the similarity to the then puzzling situation in two-dimensional transonic flow, where the pressure drag from linear supersonic theory becomes unreasonably high (in fact, rises without bound) as the free-stream Mach number approaches 1 from above. The similarity was supported by the fact that at free-stream Mach numbers above 1, the Mach number of the velocity component normal to the Mach cone, which coincided with the leading edge of the wing for sweep of ±43°, is likewise 1. (The difficulty in the two-dimensional case was indeed shown soon after to be due to nonlinear transonic effects inaccessible to linear theory.)

The most significant results concerning drag, however, dealt with that of triangular wings. A reason for the notice given Puckett’s theoretical work appears in the lower curve in figure 9, which shows how the minimum pressure drag of a triangular wing with uncambered double-wedge section and leading edge inside the Mach cone varies as the position of maximum thickness is altered. Results of this kind suggested that the drag of such wings could be lowered significantly by placing the position of maximum thickness (i. e., the ridge line of the double wedge) well forward on the wing. To assess this encouraging finding, our tests were extended to include the two triangular wings shown by the sketches, one with maximum thickness at 50-percent chord, the other at 20-percent.

As indicated by the small circles, the experimental measurements did not come out as hoped; the 20-percent location, in fact, gave a slightly higher drag than the 50-percent. Repeated tests showed that experimental error could not be blamed, and theoretical estimates indicated that support-body interference could hardly

M0* 1.53

section: uncambered

GENERATING NEW KNOWLEDGE, 1946-1948

Fig 9. Effect of position of maximum thickness on minimum drag of triangular wings.

account for the large increment above the pressure drag for either wing. Consideration of viscous friction finally suggested an explanation. As always, two kinds of friction must be considered: laminar friction, due to air flowing in a smooth, lamina-like boundary layer near the wing surface, and turbulent friction, associated with an eddying, more or less chaotic boundary-layer flow. Most wing boundary layers start out laminar and change to turbulent at some point aft of the leading edge; the location of this point is important, since a turbulent layer exerts considerably higher drag than a laminar one. Since location of the transition point was unknown, however, the best we could do theoretically for the total drag was to add to the curve of pressure drag in figure 9 a uniform friction drag under the assumptions of completely laminar and completely turbulent boundary layers. The positions of the experimental measurements relative to the two resulting curves suggested that the proportion of laminar to turbulent flow on the two wings might be considerably different.

This seemed as far as we could go until I happened, while browsing in the laboratory library, upon a report by W. E. Gray of the British Royal Aircraft Establishment describing a new “liquid-film” method he was using for experimental location of transition at subsonic speeds.15 In applying this method to our situation (after considerable developmental effort), a model was sprayed with a flat black lacquer and coated, just before installation in the tunnel, with a liquid mixture containing mainly glycerin. Since evaporation takes place much faster in a turbulent than a laminar region, it was then a simple matter to run the tunnel (sometimes as much as 20 minutes) until the liquid had disappeared where the boundary layer was turbulent but remained where it was laminar. By dusting the model with talcum powder, which adhered to the moist but not the dry area, the regions of laminar and turbulent flow could then be made visible.

Results for the two triangular wings appear in figure 10. With the maximum thickness at 50-percent chord, turbulent flow (the dark area) takes up only about half of the area aft of the ridge line; for the 20-percent chord location, turbulent flow occupies almost all of the considerably larger area to the rear of the ridge. As a general thing, laminar boundary layers tend to exist in regions in which the surface pressure decreases in the direction of flow, turbulent layers in regions in which it increases. Examination of the theoretically calculated pressure distributions for the two wings showed excellent correlation in both cases between these latter regions of “adverse pressure gradient” and the experimentally indicated regions of turbulent flow. Both the experimental and the detailed theoretical results thus implied a relatively larger viscous drag with the maximum thickness at 20-percent. Support – body interference prevented a decisive comparison between the experimental values of total drag and theoretical values calculated on the basis of the observed areas of laminar and turbulent flow. There could be little doubt, however, why forward displacement of the maximum thickness failed to produce the reduction predicted by inviscid theory.

Following appearance of our third report, NACA headquarters in Washington instructed that I prepare a summary for a joint conference of the American Institute

GENERATING NEW KNOWLEDGE, 1946-1948

Fig 10. Results of liquid-film tests on triangular wings at zero lift (minimum drag).

of the Aeronautical Sciences and the British Royal Aeronautical Society, to be held in New York City in May, 194916. My paper (from which figures 2 through 10 here are taken) was one of two from the NACA, the other being by Floyd Thompson of the Langley Laboratory dealing with rocket and falling-body tests at transonic speeds. That headquarters saw fit to declassify some of our results for this purpose suggests an eagerness, for whatever reason, to point to NACA’s competence in the increasingly important field of supersonic (as well as transonic) research. Our full reports became declassified in 1953.

In the end, our research did not provide an immediate tool for design – nor did we expect it to at this early stage in a complicated and unexplored area of engineering knowledge. Comparison of linear theory with experiment did give confidence in the theory’s potential as a quantitative design tool for certain properties of certain classes of wings. For other properties or other wings, differences between experiment and the findings from the linear inviscid approximation could be estimated or otherwise reconciled. In still other instances, the results posed more questions than they answered. In general, a great deal more would need to be done to achieve anything that could be included under the heading, mentioned in the introduction, of “theoretical design methods” – that is, reasonably general methods of quantitative use to the aircraft designer. The outcome overall was what one might expect at this stage in a new and unexplored area of complex engineering knowledge.

THE UNSTABLE SEED OF DESTRUCTION

We now come to a point where we can begin to answer the question addressed at the outset. A history of a nearly punctiform event, conducted with essentially unlimited resources, yields a remarkable document. Freed by wealth to explore at will, the NTSB could mock up aircraft or recreate accidents with sophisticated simulators. Forensic inquiries into metallurgy, ffactography, and chemical analysis have allowed extraordinary precision. Investigators have tracked documents and parts back two decades, interviewed hundreds of witnesses, and in some cases ferreted out real-time photographs of the accident in progress. But even when the evidence is in, the trouble only just begins. For deep in the ambition of these investigations lie contradictory aims: inquiries into the myriad of necessary causes evaporate any single cause or single cluster of causes from fully explaining the event. At the same time, the drive to regain control over the situation, to present recommendations for the future, to lodge moral and legal responsibility all urge the narrative towards a condensed causal account. Agency is both evaporated and condensed in the investigative process. Within this instability of scale the conflict between undefinable skill and fixed procedure is played out time and again. On the flightdeck and in the maintenance hangers, pilots and technicians are asked at one and the same time to use an expansive, protocol-defying judgment and to follow restricted set procedures. Both impulses – towards diffused and localized accounts – are crucial. We find in systemic or network analysis an understanding of the connected nature of institutions, people, philosophies, professional cultures, and objects. We find in localization the prospect of immediate and consequential remediation: problems can be posed and answered by pragmatic engineering. To be clear: I do not have the slightest doubt that procedural changes based on accident reports have saved lives. At the same time, it is essential to recognize in such inquiries and in technological-scientific history more generally, the inherent strains between these conflicting explanatory impulses.

In part, the impulse towards condensation of cause, agency, and protocol in the final “probable cause” section of the accident report emerges from an odd alliance among the sometimes competing groups that contribute to the report. The airplane industry itself has no desire to see large segments of the system implicated, and pushes for localization both to solve problems and to contain litigation. Following United’s 232 crash, General Electric (for example) laid the blame on United’s fluorescent penetration inspection and ALCOA’s flawed titanium.57 Pilots have a stake in maintaining the status of the captain as fully in control of the flight: their principal protest in the 232 investigation was that the FAA’s doctrine of “extremely improbable” design philosophy was untenable. In particular, the pilots lobbied for a control system for wide body planes that would function even if all hydraulic fluid escaped.58 But just in the measure that the pilots remain authors of the successful mission, they also have their signatures on the accident, and their recommendation was aimed at insuring that a local fix be secured that would keep their workplace control uncompromised. Government regulators, too, have an investment in a regulatory structure aimed at local causes admitting local solutions. Insofar as regulations protect safety, the violation of regulations enter as potential causal elements in the explanation of disaster. Powerful as this confluence of stakeholders can be in focusing causality to a point, it is not the whole of the story.

Let us push further. In the 1938 Civil Aviation Act that enjoined the Civil Aeronautics Authority to create accident reports, it is specified that the investigation should culminate in the ascription of a “probable cause” of the accident.59 Here “probable cause” is a legal concept, not a probabilistic one. Indeed, while probability plays a vital role in certain sectors of legal reasoning, “probable cause” is not one of them. Instead, “probable cause” issues directly from the Fourth Amendment of the U. S. Constitution, prohibiting unreasonable searches and seizures, probable cause being needed for the issuance of a warrant. According to Fourth Amendment scholar Wayne R. LaFave, the notion of probable cause is never defined explicitly in either the Amendment itself nor in any of the federal statutory provisions; it is a “juridical construct.” In one case of 1925, the court ruled that if a “reasonably discreet and prudent man would be led to believe that there was a commission of the offense charged,” then, indeed, there was “probable cause justifying the issuance of a warrant.”60 Put bluntly in an even older (1813) ruling,

probable cause was not “proof’ in any legally binding sense; required were only reasonable grounds for belief. “[T]he term ‘probable cause’ … means less than evidence which would justify condemnation.”61

Epistemically and morally, probable cause inculpates but does not convict. It points a finger and demands explanation of the evidence. Within the framework of accidents, however, in only the rarest of cases does malicious intent figure in the explanation, and this very circumstance brings forward the elusive notion of “human error.” Now while the notion of probable cause had its origins in American search and seizure law, international agreements rapidly expanded its scope. Delegates from many countries assembled in Chicago at the height of World War II to create the Convention on International Civil Aviation. Within that legal framework, in 1951 the Council of the International Civil Aviation Organization (ICAO) adopted Annex 13 to the Convention, an agreement specifying standards and practices for aircraft accident inquiries. These were not binding, and considerable variation existed among participating countries.

Significantly, though ICAO documents sometimes referred to “probable cause” and at other times to “cause,” their meanings were very similar – not surprising since the ICAO reports were so directly modeled on the American standards. ICAO defined “cause,” for example, in 1988 as “action(s), omission(s), event(s), condition(s), or a combination thereof, which led to the accident or incident.”62 Indeed, ICAO moved freely in its documents between “cause” and “probable cause,” and for many years ICAO discussion of cause stood extremely close to (no doubt modeled on) the American model.63 But to understand fully the relation between NTSB and ICAO inquiries, it would be ideal to have a case where both investigations inquired into a single crash.

Remarkably, there is such an event precipitated by the crash of a Simmons Airlines/American Eagle Avions de Transport Regional-72 (ATR-72) on 31 October 1994 in Roselawn, Indiana. On one side, the American NTSB concluded that the probable cause of the accident was a sudden and unexpected aileron hinge reversal, precipitated by a ridge of ice that accumulated beyond the de-ice boots. This, the NTSB investigators argued, took place 1) because ATR failed to notify operators how freezing precipitation could alter stability and control characteristics and associated behaviors of the autopilot; 2) because the French Directorate General pour Aviation Civile failed to exert adequate oversight over the ATR-72, and 3) because the French Directorate General pour Aviation Civile failed to provide the Federal Aviation Authority with adequate information on previous incidents and accidents with the ATR in icing conditions.64 Immediately the French struck back: It was not the French plane, they argued, it was the American crew. In a separate volume, the Bureau Enquetes Accidents submitted, under the provisions of ICAO Annex 13, a determination of probable cause that, in its content, stood in absolute opposition to the probable cause adduced by the National Transportation Safety Board. As far as the French were concerned, the deadly ridge of ice was due to the crew’s prolonged operation of their flight in a freezing drizzle beyond the aircraft’s certification envelope – with an airspeed and flap configuration altogether incompatible with the Aircraft Operating Manual.65

In both American and French reports we find the same instability of scale that we have already encountered in Air Florida 90 and United 232. On one hand both Roselawn reports zeroed in on localized causes (though the Americans fastened on a badly designed de-icing system and the French on pilot error), and both reports pulled back out to a wider scale as they each pointed a finger at inadequate oversight and research (though the Americans fastened on the French Directorate General and the French on the American Federal Aviation Authority). For our purposes, adjudicating between the two versions of the past is irrelevant. Rather I want to emphasize that the tension between localized and diffused causation remains a feature of all these accounts, even though some countries conduct their inquiries through judicial rather than civil authority (and some, such as India, do both). Strikingly, many countries, including the United States, have become increasingly sensitive to the problematic tension between condensed and diffused causation-contrast, for example, the May 1988 and July 1994 versions of Annex 13:

May 1988: “State findings and cause(s) established in the investigation.”

July 1994: “List the findings and causes established in the investigation. The list

of causes should include both the immediate and the deeper systemic causes.”66

Australia simply omits a “cause” or “probable cause” section. And in many recent French reports – such as the one analyzing the January 1992 Airbus 320 crash near Strasbourg – causality as such has disappeared. Does this mean that the problem of causal instability has vanished? Not at all. In the French case, the causal conclusion is replaced by two successive sections. One, “Mechanisms of the Accident,” aimed specifically at local conditions and the second, “Context of Use” (Contexte de Vexploitation”) directed the reader to the wide circle of background conditions.67 The drive outwards and inwards now stood, explicitly, back to back. Scale and agency instability lie deep in the problematic of historical explanation, and they survive even the displacement of the specific term “cause.”

There is enormous legal, economic, and moral pressure to pinpoint cause in a confined spacetime volume (an action, a metal defect, a faulty instrument). A frozen pitot tube, a hard alpha inclusion, an ice-roughened wing, a failure to throttle up, an overextended flap – such confined phenomena bring closure to catastrophe, restrict liability and lead to clear recommendations for the future. Steven Cushing has written effectively, in his Fatal Words, of phrases, even individual words, that have led to catastrophic misunderstandings.68 “At takeoff,” with its ambiguous reference to a place on the runway and to an action in process, lay behind one of the greatest aircraft calamities when two jumbo jets collided in the Canary Islands. Effectively if not logically, we want the causal chain to end. Causal condensation promises to close the story. As the French Airbus report suggests, over the last twenty-five years the accident reports have reflected a growing interest in moving beyond the individual action, establishing a mesoscopic world in which patterns of behavior and small-group sociology could play a role. In part, this expansion of scope aimed to relieve the tension between diagnoses of error and culpability. To address the dynamics of the small “cockpit culture,” the Safety Board, the FAA, the pilots, and the airlines brought in sociologists and social psychologists. In the Millsian world of CRM that they collectively conjured, the demon of unpredictable action in haste, fear or boredom is reduced to a problem of information transfer. Inquire when you don’t know, advocate when you do, resolve differences, allocate resources – the psychologists urged a new set of attitudinal corrections that would soften the macho pilot, harden the passive one and create coordinated systems. Information, once blocked by poisonous bad attitudes, would be freed, and the cockpit society, with its benevolent ruling captain, assertive, clear-thinking officers, and alert radio-present controllers, would outwit disaster. As we saw, under the more sociological form of CRM, it has been possible, even canonical, to re-narrate crashes like Air Florida 90 and United 232 in terms of small-group dynamic. But beyond the cockpit scale of CRM, sociologists have begun to look at larger “organizational cultures.” Diane Vaughan, for example, analyzed the Challenger launch decision not in terms of cold О-rings or even in the language of managerial group dynamics, but rather through organizational structures: faulty competitive, organizational, and regulative norms.69 And James Reason, in his Human Error invoked a medical model in which ever-present background conditions located in organizations are like pathogens borne by an individual: under certain conditions disease strikes. Reason’s work, according to Barry Strauch, Chief of the Human Performance Division at the NTSB, had a significant effect in bolstering attention to systemic, organizational dynamics as part of the etiology of accidents.70

Just as lines of causation radiate outwards from individual actions through individuals to small collectives, so too is it possible to pull the camera all the way back to a macroanalysis that puts in narrative view the whole of the technological infrastructure. Roughly speaking, this was Charles Perrow’s stance in his Normal Accidents.71 For Perrow, given human limitations, it was simply inevitable that tightly-coupled complex, dangerous technologies have component parts that interact in unforeseen and threatening ways.

Our narration of accidents slips between these various scales, but the instability goes deeper in two distinct ways. First, it is not simply that the various scales can be studied separately and then added up. Focusing on the cubic millimeter of hard alpha inclusion forces us back to the conditions of its presence, and so to ALCOA, Titanium Metals Inc., General Electric, or United Airlines. The alpha inclusion takes us to government standards for aircraft materials, and eventually to the whole of the economic-regulative environment. This scale-shifting undermines any attempt to fix a single scale as the single “right” position from which to understand the history of these occurrences. It even brings into question whether there is any single metric by which one can divide the “small” from the “large” in historical narration.

Second, throughout these accident reports (and I suspect more generally in historical writing), there is an instability between accounts terminating in persons and those ending with things. At one level, the report of United 232 comes to rest in the hard alpha inclusion buried deep in the titanium. At another level, it fingers the maintenance technician who did not see fluorescent penetrant dye glowing from a crack. Read different ways, the report on Air Florida flight 90 could be interpreted as spotlighting the frozen pitot tube that provided a low thrust indication; read another way the 737’s collision impact into the Fourteenth Street Bridge was due to the pilot’s failure to de-ice adequately, to abort the takeoff, or to firewall the throttle at the first sign of stall. Protocol and judgment stood in a precarious and unstable equilibrium. What to the American investigators of the Roselawn ATR-72 crash looked like a technological failure appeared to the French team as a human failing.

Such a duality between the human and the technological is general. It is always possible to trade a human action for a technological one: failure to notice can be swapped against a system failure to make noticeable. Conversely, every technological failure can be tracked back to the actions of those who designed, built, or used that piece of the material world. In a rather different context, Bruno Latour and Michel Callon have suggested that the non-human be accorded equal agency with the human.72 I would rather bracket any fixed division between human and technological in our accounts and put it this way: it is an unavoidable feature of our narratives about human-technological systems that we are always faced with a contested ambiguity between human and material causation.

Though airplane crashes are far from the world of the historian of science and technology or that of the general historian interested in technology, the problems that engaged the attention of the NTSB investigators are familiar ones. We historians also want to avoid ascribing inarticulate confusion to the historical actors about whom we write – we seek a mode of reasoning in terms that make sense of the actors’ understanding. We try to reconstruct the steps of a derivation of a theorem or the construction of an object just as NTSB investigators struggle to recreate the Air Florida 90’s path to the Fourteenth Street Bridge. We interpret the often castaway, fragmentary evidence of an incomplete notebook page or overwritten equation; they argue over the correct interpretation of “really cold” or “that’s not right.”

But the heart of the similarity lies elsewhere, not just in the hermeneutics of interpretation but in the tension between the condensation and diffusion of historical explanation. The NTSB investigators, like historians, face a world that often doesn’t make sense; and our writings seek to find in it a rational kernel of controllability. We know full well how interrelated, how deeply embedded in a broader culture scientific developments are. At the same time we search desperately to find a narrative that at one moment tracks big events back to small ones, that hunts a Copemican revolution into the lair of Copernicus’s technical objections to the impure equant. And at another moment the scale shifts to Copernicus’s neo-Platonism or his clerical humanism.73 At the micro-scale, we want to find the real source, the tiny anomaly, asymmetry, or industrial demand that eats at the scientific community until it breaks open into a world-changing discovery. Value inverted, from the epoch-defining scientific revolution to the desperate disaster, catastrophe too has its roots in the molecular: in a badly chosen word spoken to the АТС controller, in a too sharp application of force to the yoke, in a tiny, deadly alpha inclusion that spread its flaw for fifteen thousand cycles until it tore a jumbo jet to pieces.

At the end of the day, these remarkable accident reports time and time again produce a double picture printed once with the image of a whole ecological world of causation in which airplanes, crews, government, and physics connect to one another, and printed again, in overstrike, with an image tied to a seed of destruction, what the chief investigator of flight 800 called the “eureka part.” In that seed almost everyone can find satisfaction. All at once it promises that guilty people and failed instruments will be localized, identified, confined, and that those who died will be immortalized through a collective immunization against repetition through regulation, training, simulation. But if there is no seed, if the bramble of cause, agency, and procedure does not issue from a fault nucleus, but is rather unstably perched between scales, between human and non-human, and between protocol and judgment, then the world is a more disordered and dangerous place. These reports, and much of the history we write, struggle, incompletely and unstably, to hold that nightmare at bay.

NACA TRANSONIC AND SUPERSONIC COMPRESSOR RESEARCH: 1945-1955

The need to use axial, instead of centrifugal, compressors in order to attain high levels of thrust in aircraft gas turbine engines had become increasingly clear by the end of World War II.29 Unlike centrifugal compressors, however, axial compressors were proving to be difficult to design with consistency. The base point in aero­dynamic design technology that had emerged by 1945 allowed efficient axial compressor stages to be designed30, but only under the restriction that the aerodynamic demands made on the compressor remained modest. The design method in question was based to a considerable extent on empirical data from tests of some airfoil profiles in cascade31 over a limited aerodynamic range. Specifically, the pressure-rise, turning, and thermodynamic losses had been determined for these airfoils in cascade as functions of incidence conditions in two-dimensional wind – tunnel tests. Compressor blades were then formed by selecting and stacking a sequence of these airfoil profiles radially on top of one another, as if the air flows through the blade row in a modular series of radially stacked two-dimensional blade passages. Achieving more ambitious levels of compressor performance was going to require this method to be extended, if not modified, and this in turn was going to require a substantial research effort, including extensive wind-tunnel tests of a wider range of airfoils in cascade. The engine companies conducted some research to this end – e. g., P&W carried out their own wind-tunnel airfoil cascade tests. Never­theless, the main body of research fell to government laboratories like the National Gas Turbine Establishment in England and the National Advisory Committee for Aeronautics in the U. S.

The applied research program on axial compressors carried out by the NACA in the decade following World War II was especially important in advancing the state of the art. This program involved a number of diverse efforts, most of them located at the Lewis Flight Propulsion Laboratory, in Cleveland, though a few at the Langley Aeronautical Laboratory, in Virginia, as well. While this research program deserves a historical study unto itself, we will confine ourselves here primarily to results that ended up contributing crucially to the design of the first successful turbofan engines. We say “ended up contributing” because none of this work appears at the time to have been aimed at the design of turbofan engines. The goal throughout was to advance the performance of axial compressors in what were then standard aircraft gas turbines.