Category Dreams of Other Worlds

Hipparcos by the Numbers

For a direct sense of what Hipparcos learned, ESA offers a sky map on its website that can easily fit in the palm of your hand.34 The “Hipparcos Star Globe” represents the brightest stars and the major constellations measured by the satellite as charts that can be printed out on two sheets of paper and then assembled into a sky sphere. In fact, for ease of construction, the sky is projected onto an icosahedron, a polyhedron with 20 triangle-shaped faces. Instructions for constructing this astronomical origami are also provided on the ESA website. This simple sky chart conveys no more than the “bony skeleton” of the night sky’s stars; Hippar – cos mapped the anatomy in exquisite detail. Its main instrument charted the positions of 118,218 stars with the highest precision.35

In addition, a beam-splitter was used with a secondary detector to map out the sky with slightly lower precision—the resulting Tycho Catalog lists 1,058,332 stars.36 Years after the satellite ceased op­eration, astronomers produced the definitive Tycho-2 Catalog, containing a prodigious 2,539,913 stars.37 That number is 99 per­cent of the stars down to 11th magnitude, which is a level 100,000 times fainter than the brightest star, Sirius. With this exquisite level of detail, Hipparcos has mapped our location in the “city of stars” called the Milky Way galaxy (plate 14).

Space missions produce data of such complexity and abundance that it’s often years before all the results are known. Hipparcos is no exception. The Tycho-2 Catalog was published in 2000, seven years after the satellite returned its last data. As recently as 2007, Dutch astronomer Floor Van Leeuwen re-analyzed the Hipparcos data. He diagnosed many small effects that had been overlooked in the original analysis, such as tiny jogs in the spacecraft’s orienta­tion due to micrometeorite impacts and subtle changes in the image geometry each time the satellite went into Earth’s shadow and then emerged into sunlight. He also took advantage of great gains in the power of computers to improve the calculation of positions. With a million stars, the number of angles between any star and all of the others is a million squared, or a trillion. To pin down the errors in positions, those trillion angles must be calculated many times, a procedure that took six months at the end of the mission but only a week when Van Leeuwen did his work using much faster proces­sors. His analysis has shrunk the errors by a factor of three from the initial goal of 0.002 arc seconds, and a factor of ten for the brightest stars.38 This minuscule angle would be formed by draw­ing lines from the top and bottom of Lincoln’s eye on a penny in New York and having them come to an apex in Paris.

The trick of Hipparcos is to measure positions across the entire sky rather than picking off stars one by one. Thus it gains from the power of large numbers. Imagine you had to cover the floor of a large room with irregular but similar-sized tiles. You could lay them out tile by tile with a good chance of keeping the separa­tion of adjacent tiles uniform, but as you covered a larger region it would become very difficult to control the uniformity. Whether you worked from the center out or the edges in or from side to side, it’s likely you’d either have tiles left over or leave a gap. The optimum solution would be to be aware of the distance between any two tiles and regulate it over the whole area, thereby filling it uniformly. If the tiles are now stars on the sky, that’s what scien­tists did with the Hipparcos data. They made an optimal solution for all stars simultaneously. In practice it was a calculation that taxed the best computers at that time.

Behind the numbers are the people who work to make a mission successful, often devoting their entire scientific careers to the task. Michael Perryman was born in the dreary industrial town of Luton, just north of London, and he was interested in math and numbers from an early age. His math teacher at school advised him to study a subject with better employment potential. He ignored the advice and studied theoretical physics at Cambridge University. For his PhD he stayed at Cambridge but switched to radio astronomy, joining a group that was still buzzing with excitement from the discovery of pulsars and the award of the Nobel Prize in Physics to Martin Ryle and Tony Hewish in 1974. At this point he has spent thirty years of his career on the unglamorous but very important work of mapping star positions, exceeding the amount of time the illustrious Tycho Brahe spent on his observations.39 Appropriately, in 2011 he was awarded the prestigious Tycho Brahe Prize by the European Astronomical Society.

Perryman was just twenty-six when he was selected to be the project scientist for the Hipparcos mission, a great honor and re­sponsibility for someone so young.40 Soon he found himself re­sponsible for the coordination of two hundred scientists and for all the headaches that go along with a complex multinational project. The biggest challenge came soon after launch when a motor on the Ariane launch rocket malfunctioned and the satellite didn’t reach its desired geostationary orbit. The unplanned orbit exposed Hip- parcos to high levels of radiation twice a day and it was thought the satellite might not last more than a few months. The team adjusted and made the best of the situation, but for over two years Perry­man lived under a “sword of Damocles” as gyros were knocked out by the radiation. In the end, the mission exceeded its design goal of both lifetime and science. Away from the project, Perryman enjoyed hiking and caving, choosing to escape underground from his upward-looking day job.

Gaia Theory and Earth System Science

Together Lovelock and Margulis theorized that Earth’s habitability was not simply a function of its orbital position relative to the Sun, but was in large part due to biota metabolizing and cycling atmo­spheric gases and rock minerals. As Margulis explained, “The me­tabolism, growth, and multiple interactions of the biota modulate

Gaia Theory and Earth System Science

Figure 2.4. Carl Sagan poses with a model of the Viking lander in Death Val­ley, California. Sagan was a pivotal figure in the mission planning, leading the argument to include a camera in the design. His research pointed to the intimate connection between the composition of a planetary atmosphere and its habit­ability (NASA/Jet Propulsion Laboratory).

the temperature, acidity, alkalinity, and, with respect to chemically reactive gases, atmospheric composition at the Earth’s surface.”63 While Lovelock considered the impact of all forms of life in using and maintaining Earth’s biosphere, Margulis’s contribution to Gaia in the early 1970s highlighted the shaping effect of microor­ganisms relative to atmospheric chemistry, rock weathering, and carbon deposition via phytoplankton onto the seafloor. Lovelock wrote: “Lynn brought her deep understanding of microbiology to what until then had been mainly a system science theory that saw a self-regulating Earth through the eyes of a physical chemist. By stressing the importance of the Earth’s bacterial ecosystem and its being the fundamental infrastructure of the planet, Lynn put flesh on the skeleton of Gaia.”64

However, in the early 1970s, when Lovelock and Margulis floated their ideas regarding Gaia, Earth sciences were largely studied in isolation. “Oxygen, for example, was thought to come solely from the breakdown of water vapour and the escape of hy­drogen into space, leaving an excess of oxygen behind,” explains

Lovelock. “Life merely borrowed gases from the atmosphere and returned them unchanged. Our contrasting view required an atmo­sphere which was a dynamic extension of the biosphere itself.”65 It’s not surprising that the Gaia hypothesis was initially contro­versial and slow to be accepted. By 1974, Lovelock and Margulis were publishing scientific papers on Gaia. However, they also pub­lished a paper for nonspecialists titled “The Atmosphere, Gaia’s Circulatory System” in Stewart Brand’s CoEvolution Quarterly.66 New Age connotations and the fact that the theory was champi­oned by many nonscientists didn’t help their cause. Another issue was the sheer complexity of the biosphere and its interlocking parts—scientists had trouble making robust and predictive models of its behavior.67 But contrary to the scientific community’s cool reception of the Gaia hypothesis, NASA was very interested in Lovelock’s ideas regarding planetary atmospheres.

Gaia Theory proposes that bacteria and other organisms not only consume and replenish atmospheric components like oxygen and methane but also maintain our biosphere’s temperature and habitability through rock weathering and the cycling of carbon, oxygen, sulfur, and other chemicals. The atmosphere is under­stood as a coupled system with the lithosphere, hydrosphere, and the planet’s biota, and these geospheres interact in cycling water, minerals, chemicals, and atmospheric gases. The theory, however, evolved over time and represented a spectrum of ideas. At one end of the spectrum was the uncontroversial premise that living organ­isms have altered Earth’s atmosphere and surface geology. Follow­ing from that is the idea that the biosphere and the Earth co-evolve in a way that is self-regulatory due to negative feedback loops. The most extreme form of the theory, containing the idea that the entire biosphere is somehow a living organism, with the teleological im­plication that the continuation of life is a purpose of co-evolution, has been discredited (and Lovelock was always clear about not subscribing to these views). Nor were Lovelock and Margulis the first to consider Earth’s biology and its geospheres as intimately coupled. Early proponents of such thinking were the eighteenth – century Scottish geologist James Hutton, the father of modern ge­ology, and the Russian mineralogist Vladimir Vernadsky. Hutton was among the first to theorize how rock cycling impacted our entire planet, referring to the Earth as a “superorganism,” while Vernadsky theorized in the early twentieth century that geologic processes contributed to sustaining the biosphere.68

Lovelock and Margulis’s integrated view supposed that micro­organisms not only maintained Earth’s habitable atmosphere and climate, but also could alter the environment on a planetary scale. For this and reasons noted above, Gaia hypothesis seemed pre­posterous to many people. However, as Lovelock explains in The Vanishing Face of Gaia (2009), “It is too often wrongly assumed that life has simply adapted to the material environment, what­ever it was at the time; in reality life is much more enterprising. When confronted with an unfavorable environment it can adapt, but if that is not sufficient to achieve stability it can also change the environment.”69 Stromatolites in Australia’s Shark Bay indi­cate, for example, that by 2.4 billion years ago the progenitors of cyanobacteria developed oxygenic photosynthesis and began to reconfigure the Earth’s early atmosphere from largely nitrogen and carbon dioxide to the nitrogen – and oxygen-rich composition we breathe today. But any correlation between the emergence of oxygen metabolizing life and global atmospheric composition is complex. Measurable levels of oxygen appeared 300 million to a billion years after the first evidence of oxygenic photosynthesis, which indicates other geologic or hydrologic processes were simul­taneously stripping oxygen from the atmosphere.70 The complex­ity of how microorganisms and geochemical processes combine to sustain or alter our atmosphere remains at the core of Gaia Theory and Earth System Science.

Gravity’s Helping Hand

Apollo 13 was crippled. Two hundred thousand miles from Earth, an oxygen tank had exploded. Damage to the Command Mod­ule was so extensive that the crew of three retreated to the Lunar Module, which they then had to use as a “lifeboat” to return home. Flight Director Gene Kranz aborted the Moon landing and consid­ered the options. The simplest would have been to use the Com­mand Module engines to reverse its direction and head for home, but it was unclear if the engines could be used safely, and Apollo 13 was already in the grip of the Moon’s gravity. So instead, Kranz authorized use of the Lunar Module engines to steer a course that would take the spacecraft behind the Moon and get a gravitational “assist” from the Moon that would send it on the correct trajec­tory for an Earth landing. It was a gutsy call. The world waited tensely as the spacecraft got a helping hand from gravity to bring the astronauts home safely.6

Traveling in the Solar System is a tussle with gravity, every as­pect of which affects the amount of fuel required for a mission and so also its cost. The initial problem is leaving Earth’s gravity. This is accomplished in two steps: first, by a large, expendable chemical rocket that can get the spacecraft into orbit, and then is jettisoned; second, by rockets onboard the spacecraft which give it the extra 40 percent of velocity needed to escape the Earth’s pull. The es­cape velocity of the Earth is 11.2 kilometers per second, or 25,000 mph. Once achieved, the spacecraft is in the Sun’s grip. Going to Venus or Mercury seems like the easy choice since the spacecraft can swoon into the Sun’s gravity, which will pull it inward. But the problem emerges when the destination is reached. How do you slow down enough to carefully study or land on your target? Going to Mars and the outer planets means swimming against the tide of the Sun’s gravity. The Sun is remote but extremely massive. So having left the Earth, it takes an extra 12.4 kilometers per sec­ond to reach Jupiter and an extra 17.3 kilometers per second to reach Saturn. Compared to what it took to leave the Earth, that’s a similar amount of extra energy to get to Jupiter and twice as much extra energy to reach Saturn. Leaving the Solar System entirely

requires a velocity of 42.1 kilometers per second, or a whopping 94,000 mph. Where is all this energy going to come from?

The answer to both questions lies in gravitational assist. Rus­sian theorists Yuri Kondratyuk and Friedrich Zander pioneered the idea in the early twentieth century, and American Michael Mi – novitch added important refinements later.7 Gravity assist was first used by the Russians to let Luna 3 photograph the far side of the Moon in 1959. NASA reprised the maneuver in 1970 to rescue Apollo 13. Here’s how it works. Imagine standing beside a railroad track as a train approaches. You throw a tennis ball at the front of the train and it comes back in your direction at a higher speed because the train transfers some energy to the ball. Similarly, if the train was traveling away from you and you threw the ball, it would come back more slowly because the train took away some of the ball’s energy. Notice that energy doesn’t appear or disappear mysteriously. When the train is coming toward you, hitting it with the ball actually slows it down, but by an incredibly tiny amount because it’s so massive. When the train is going away from you, hitting it with the ball speeds it up by a tiny amount. In the case of gravity, there’s no physical contact as the force operates through a vacuum. When a spacecraft approaches a slower moving planet from behind, the spacecraft slows down by transferring some en­ergy to the planet. Conversely, when a faster-moving planet ap­proaches a spacecraft from behind, the spacecraft speeds up by gaining some energy from the planet. The idea works with moons as well as planets.8

Pioneer 10 was the first NASA spacecraft to benefit from gravity assist, using an encounter with Jupiter in 1973 to double its speed and send it someday out of the Solar System. Pioneer 11 followed suit a year later. Also in 1974, Mariner 10 passed close by Venus on its way to exploring Mercury. More recently, the MESSENGER probe needed one flyby of Earth, two flybys of Venus, and three flybys of Mercury to lose enough energy to be captured into an orbit of the innermost planet in 2011. For probes heading into the outer Solar System, it’s worth going out of your way to get a boost from gravity. Galileo and Cassini both took inward detours to Venus to get a “kick” that helped them explore the gas giants. Energy truly is conserved in this gravitational ballet. When MES-

SENGER used Mercury to slow down and go into an orbit, it gave the planet some energy and nudged it a tiny bit farther from the Sun. And when Pioneer “robbed” Jupiter of some of its energy, it pushed the giant planet very slightly closer to the Sun.

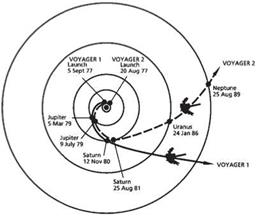
The two Voyagers launched from Cape Canaveral in Florida in the summer of 1977. Their Titan III/Centaur launch vehicle only provided enough energy to get to the distance of Jupiter. Without Jupiter’s help the spacecraft would have remained in elliptical or­bits that never got closer to the Sun than Earth and never got far­ther from the Sun than Jupiter. But NASA engineers had planned for Jupiter to be coasting by at the right time to give each of the spacecraft a boost. Although Voyager 1 left second, it took a faster and more direct route that got it to Jupiter first, and then Saturn, but at the cost of not visiting the outermost planets. It could have visited Pluto, but this possibility was sacrificed for a close look at Titan. In 1998, Voyager 1 overtook the slower moving Pioneer 10 to become the most distant human artifact. Voyager 2 took a more circuitous route through the Solar System, flying by each of the four gas giants and gaining a modest gravity boost from each encounter (figure 4.1).9 The Voyagers were originally con­ceived to take advantage of a once-i n-176-year opportunity: the near-perfect alignment of all four gas giants and Pluto. Aerospace engineer Gary Flandro pushed for NASA to take advantage of the alignment with a planetary “Grand Tour,” but the vision was com­promised by budget cuts so the Voyager executed a scaled-back version of the concept.

Flying Rings around Saturn

At its closest approach to the Earth, Saturn is about eight times the Earth-Sun distance, or 800 million miles away. Yet, by the time Cassini reached Saturn it had traveled 2.2 billion miles. NASA launched Cassini with the best rocket available, but it wasn’t pow­erful enough to get the spacecraft to Saturn directly since it would be fighting against the Sun’s gravity all the way. So mission design­ers used gravity assist, colloquially called the gravitational “sling­shot” mechanism, to get it to its target. As we saw in the last chap­ter with Voyager, this technique has been used since the 1970s to get nature’s help in hefting planetary probes away from the Sun’s gravity.24 The assist is provided by bringing the spacecraft along­side a planet from behind and letting it get a “kick” from the or­bital angular momentum of the planet. In principle the spacecraft can get a speed boost of up to twice the planet’s orbital velocity.

Cassini passed by Venus twice, then the Earth, and finally Jupi­ter before heading to Saturn. The terrestrial flyby was controver­sial because of the nature of Cassini’s power source. Solar panels aren’t feasible for a mission so far from the Sun’s rays. So Cas­sini has three generators where radioactive decay of plutonium – 238 generates electricity via a thermocouple. The power source had raised congressional eyebrows before launch, but as the flyby approached, NASA was told to do an environmental impact as­sessment on the possibility of Cassini impacting the Earth. For a worst case scenario of a shallow angle of entry to the atmosphere and slow dispersal of the radioactive materials, the odds were one in 10 million.25 NASA was allowed to proceed. There were dem­onstrators and a few lawsuits, but the launch and flyby went off without a hitch and now the plutonium is at a safe distance of a billion miles.

These flybys were just a warm-up for the amazing series of grav­itational dances that Cassini engaged in when it got to Saturn (fig­ure 5.3). Over its core mission, Cassini orbited Saturn 140 times. To see Saturn, its rings, its largest moons, and its magnetosphere from all conceivable angles, Cassini is using its rockets and sev­enty gravity-assist flybys of Titan to tweak its orbit size, period, velocity, and inclination from Saturn. As the largest moon, Titan is

40


Подпись: km/s
Flying Rings around Saturn

Figure 5.3. The speed of the Cassini spacecraft relative to the Sun during its first decade of travel. The early peaks are gravitational slingshot maneuvers to enable it to reach Saturn with the appropriate velocity for insertion into orbit around Saturn. The later variations are cleverly arranged flybys of Saturn’s moons (Wikimedia Commons/YaoHua2000).


Flying Rings around Saturn

the most useful in “steering” Cassini around the Saturnian system. Each Titan flyby is engineered to return Cassini into the proper trajectory for its next Titan flyby. Encounters with other moons are performed opportunistically with what’s called a targeted flyby. About fifteen are planned by the end of the mission, half to the intriguing small moon Enceladus. From 2004 through 2011, Cas­sini did a dizzying hundred flybys, with another dozen completed in 2012. NASA hosts a clock counting down the time until the next swooping visit to a moon and coyly calls these “Tour Dates” to appeal to a younger generation.26 By clever planning, NASA engineers have doubled the length of the mission even though just a quarter tank of fuel remains.

Titan’s gravity has also been used to gradually tilt the inclina­tion of Cassini’s orbit, allowing it to see the rings from above and below, and to see atmospheric phenomena of Saturn’s poles for the first time. Flybys of Titan can’t get closer than 600 miles, or the large moon’s thick atmosphere would slow the spacecraft. Some flybys to small moons have been as close as 15 miles. At a distance of a billion miles, that’s like hitting a golf ball coast to coast and dropping it within an inch of the hole! There’s another problem with operating such a remote probe. Depending on where Earth and Saturn are in their orbits, the distance between them can vary from eight to ten astronomical units or Earth-Sun distances. It therefore takes 70 to 85 minutes for radio commands to travel
from mission control to the spacecraft, and the same for the re­verse journey. Controllers can’t give “real-time” commands. Even if they responded immediately to a problem, nearly three hours would pass before Cassini would get the response. This casts the flybys in an entirely new light, since the margin of error is less than a second.

A World by Any Other Name

Comets and asteroids provide evidence of the formation epoch of our Solar System. They represent the pristine stardust of which we are made. They’re implicated in life and death in the evolution of life on Earth. But they’re minor bodies of the Solar System. The three targets of Stardust’s study are a motley, misshapen collec­tion. There’s 5535 Annefrank, three miles across and shaped like a right-angled prism. There’s Wild 2, similar in size, with a pitted and coruscated surface. And there’s 9P/Tempel, slightly larger and shaped like a potato. Are they big enough to be called worlds? Are they substantial enough to have a place in our dreams?

Yes, absolutely. They may be too small to hold an atmosphere, but comets and asteroids have unique shapes and topographies that imbue them with personality. Our technology is good enough to throw a gravity “lasso” around a space rock that ventures near us and steer it into Earth orbit. Comets contain water ice and organic material needed to sustain life, and the hydrogen and oxygen in the water are all that’s needed to make rocket fuel. A comet retained in high Earth orbit would be a perfect jumping-off point for manned exploration of the outer Solar System and beyond. Asteroids also contain valuable metals and minerals; according to one estimate, the mineral wealth in the asteroid belt amounts to $100 billion for every person on Earth.52 Wild 2 probably contains around $20 trillion worth of precious and industrial metals, and over $100 bil­lion worth of platinum alone.53 In fact, the precious metals we do have were gifts from comets in the early days of the Solar System. Metals present when the Earth formed settled directly to the core while the planet was molten; those we can reach in the crust were “dusted” onto the planet by later waves of comets.54

Space mining aside, a small, barren rock might not be worth calling your own. The 1967 United Nations Outer Space Treaty prohibits any State owning or controlling the Moon, an asteroid, or a comet, but the treaty has a loophole since it doesn’t specifi­cally exclude the ownership rights of an individual.55 A small world might seem limiting, but think of the pleasure in owning a world the size of a small town and surveying the domain like a colossus. The gravity of Wild 2 is so weak you would literally be as light as a feather. A small push and you could escape your world and sail into deep space. And think of the glittering minerals—a hoard magnificent enough to power all the dreams ever dreamed.

Stepping Out into the Universe

It sounds implausible that a small telescope with a single mode of observing could touch every area of astrophysics from planets to cosmology, but that’s the legacy of Hipparcos. By measuring the positions of more than 100,000 stars two hundred times more ac­curately than ever before, Hipparcos redefined and recalibrated the basic ingredients of stars, and that’s fundamental because stel­lar properties lie at the base of a pyramid of methods used to es­tablish the distance to nearby galaxies and on into the universe.41 Without a tether in nearby stars, the entire edifice of the cosmo­logical interpretation of redshift, where the shift of galaxy radia­tion to longer wavelength is used to ascribe a distance according to cosmic expansion, would be suspect.

In the Solar System, distances to the planets are known with very high precision. We can bounce radar off Mercury, Venus, and Mars, and measure the time of its round-trip journey to derive distance. Kepler’s laws provide the relationship between orbit pe­riod and distance that lets us calculate the distance to the outer planets. Beyond the Solar System, even the nearest star is trillions of miles away. The most direct method of measuring distance uses the slightly different perspectives on a nearby star between when the Earth is six months apart in its orbit of the Sun. As we’ve seen, this is stellar parallax. A skinny triangle in space is created with the base equal to the Earth’s orbital diameter and the long sides hun­dreds of thousands of times longer. Distances measured by trigo­nometry involve no assumptions (except that three-dimensional space is flat and Euclidean) so they form the secure base for all other distance determinations in the universe.42

As astronomers step out through the universe, no single method of measuring distance works on all scales. So they have to step out with a series of overlapping indicators, each of which has a range of applicability. Like a series of ladders climbing high into the sky, where a wobbly lower ladder causes the whole edifice to sway, a tighter local distance scale ensures more accurate distances to galaxies. Before Hipparcos, astronomers had measured the dis­tances to several dozen stars with just 1 percent precision. Hip – parcos increased that haul by more than an order of magnitude to more than four hundred stars. At the precision level of 5 percent, Hipparcos increased the number of stars with reliable triangulated distance from one hundred to over seven thousand. Good distance determinations are now widely available out to nearly five hun­dred light-years from the Sun. That’s a small patch of the Milky Way, which is 100,000 light-years across, but it’s a patch large enough to include all stellar types and almost all known exoplan­ets. The precision of the distances maps into a similar precision for the derived parameters such as size, luminosity, and mass.

Hipparcos measured the distance of the bright star Polaris as 432 light-years and tightened the error from thirty to seven light- years. Polaris is important for the distance scale because it’s the closest and brightest Cepheid variable star, whose properties define a distance indicator that can be used from our neighborhood in the Milky Way out to galaxies tens of millions of light-years away. Un­fortunately, Polaris turns out to be anomalous and a recent study revised the Hipparcos distance down by a third to 323 light-years.43 Another bright star, Deneb, had an estimated distance of 3,200 light-years that was almost completely indeterminate; its distance firmed up to 1,400 light-years with an error of 230 light-years. Hipparcos also measured distances to a few open star clusters like the Pleiades and the Hyades, which allows bridges to be built to more remote regions of space.44 First, the trend line of main se­quence stars—a relationship between luminosity and temperature when the energy source is hydrogen fusion—can be fit for all stars within the cluster. The offset between the main sequence best fits for two clusters gives the relative distance because the brightness of the stars goes down with the square of the increasing distance. Second, a cluster will contain rare variable stars like Cepheids and RR Lyraes that can be seen to very large distances (Polaris is a nearby Cepheid variable). Cepheids have a useful linear relation­ship between their luminosity and the period of their variability, so knowing the period and the relative brightness of two Cepheids gives the relative distance between them.45

Nearby variable stars with parallax measurements can be used to reach out to analogous variables in galaxies as far away as the Virgo Cluster, 54 million light-years away. Once in the realm of galaxies, global properties of galaxies such as their rotation rates and sizes are used to calculate relative distances. By now, the lad­der is getting rickety and errors are 10 percent or more. Thereafter, the expansion of the universe imprints a redshift on all galaxies, and distances can be derived in the context of the big bang model, which relates distance to recession velocity for all galaxies. Ex­ploding stars called supernovae are also used to estimate distances in the remote universe, billions of light-years from the Earth, but all these methods are rooted in the work of the modest Hipparcos telescope.

NASA and Earth Observation

“When you cut your teeth on other worlds,” Carl Sagan once noted, “you gain a perspective about the fragility of planetary envi­ronments and about what other, quite different, environments are possible.”71 Sagan points to James Hansen’s research of Venus that led to early climate models to predict how greenhouse gases had been trapped in its atmosphere and might similarly impact Earth’s climate, as well as Mario Molina and Sherwood Rowland’s inves­tigation of chlorine and fluorine molecules in Venus’s atmosphere that led to an understanding of the threat of CFCs to Earth’s ozone layer. These investigations of Venus revealed that Earth’s dynamic biosphere could lose its ability to support life.

Lovelock has expressed his concern not so much that our car­bon footprint will destroy the Earth, but that warming of Earth’s atmosphere could mean the end of our civilization as we know it. Suggesting we make plans for “sustainable retreat,” Lovelock at the age of eighty-nine comments, “It’s really a question of. . . where we will get our food, water. How we will generate energy.”72 This is not a new position for Lovelock. Even from the beginning stages of Gaia Theory, Steven Dick and James Strick comment, “He realized that the gases that living organisms most actively af­fect, especially carbon dioxide, methane, oxygen and water vapor, are just those gases that most dramatically shape the climate of a planet.”73 “I can only guess the details of the warm spell due,” wrote Lovelock in 1988. “Will Boston, London, Venice, and the Netherlands vanish beneath the sea? Will the Sahara extend to cross the equator?”74 He’s not being facetious.

In The Ice Chronicles, scientist Paul Mayewski and science writer Frank White discuss the findings from the Greenland Ice Sheet Project 2’s (GISP2) ice cores drilled in central Greenland in 1990. The cores capture a 100,000-year record of the chemi­cal composition of Earth’s atmosphere and a picture of the rate of thinning of Greenland’s glaciers. Of the book, Lynn Margulis noted, “The story of how international science obtained this fund of Pleistocene data from the central Greenland ice sheet reads like a novel.”75 However, this text isn’t some action-adventure tale of humans against nature, but a serious assessment of changes in at­mospheric composition over long time scales. Captured deep in the Greenland ice are tiny air bubbles that serve as time capsules from thousands of years ago. Scientists can analyze the air in the bubbles to determine the composition of Earth’s atmosphere in ages past. Mayewski and White assert unequivocally that increases in methane and carbon dioxide produced through industry, agri­culture, and mass transport are dramatically warming our planet’s atmosphere. They write: “As with CO2, methane is increasing at a rate that has never before been seen, and, as with CO2, the in­crease correlates strongly with rising temperatures. . . . The result is that we are having a profound impact on the climate system.” Mayewski and White note that the ice core data indicate that eco­systems on a global scale can be “easily and quickly disturbed.”76 Climatologists are concerned that global warming could cause the collapse of the world’s ice sheets, which in turn would produce an unprecedented rise in sea level. In 2011, British glaciologist Alun Hubbard reported that an expanse of glacial ice estimated at twice the size of Manhattan was on the brink of breaking free from Greenland. The previous year a stretch of ice four times the size of Manhattan, spanning 112 square miles, broke off the Greenland Ice Sheet and was adrift at sea in large chunks. “The freshwater stored in this ice island could keep the Delaware or Hudson rivers flowing for more than two years,” estimated Andreas Muenchow at the University of Delaware. “It could also keep all U. S. public tap water flowing for 120 days.”77 Though Muenchow emphasizes that ocean scientists, glaciologists, and climatologists cannot yet predict the effects of melting glacial ice, he is nevertheless con­cerned, and he’s not alone. The 2001 Amsterdam Declaration on Global Change reads:

Global change cannot be understood in terms of a simple cause – effect paradigm. Human-driven changes cause multiple effects that cascade through the Earth System in complex ways. These effects interact with each other and with local – and regional-scale changes in multidimensional patterns that are difficult to understand and even more difficult to predict. . . . In terms of some key environmental pa­rameters, the Earth System has moved well outside the range of the natural variability exhibited over the last half million years at least. The nature of changes now occurring simultaneously in the Earth System, their magnitudes and rates of change are unprecedented. The Earth is currently operating in a no-analogue state.78

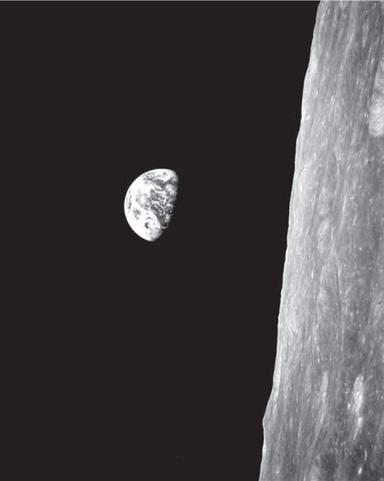
It’s no coincidence that Gaia Theory emerged in the late 1960s and early 1970s at the height of the Space Age, precisely as space travel and satellite observation began offering consistent and detailed global views of Earth (figure 2.5). NASA’s Landsat 1, launched in 1972, was the first satellite dedicated solely to Earth observation, particularly of landmasses.79 Nor is it surprising that

NASA and Earth Observation

Figure 2.5. Earthrise in the orientation from which the Apollo 8 crew saw it from lunar orbit. In zero gravity, the normal senses of up, down, and the horizon have no particular meaning. Just two dozen astronauts have ever experienced the extraordinary sight of their home planet rising over the horizon of another world (NASA/Apollo 8).

the original cover of Lovelock’s book Gaia: A New Look at Life on Earth (1979) was illustrated with Apollo 17’s Whole Earth photo­graph, considered among photo historians as the most reproduced image in history. While “Gaia theory forces a planetary perspec­tive,” as Lovelock points out, that invaluable perspective was only possible with a serious commitment to space exploration. “It took the view of the Earth from space,” writes Lovelock, “either directly through the eyes of an astronaut, or vicariously through visual media, to let us sense a planet on which living things, the air, the oceans, and rocks all combine in one as Gaia.”80

By 1983, NASA had established the Earth System Sciences Com­mittee (ESSC) to publish recommendations for a concerted science program in global Earth studies and satellite observing programs. NASA’s planetary science and recent Earth observing missions have offered scientists their best understanding yet of the complex and interconnected Earth systems that sustain our biosphere. Several missions are specifically focused on understanding and mitigating, if possible, the effects of industrialized human activity.

NASA’s GOES satellites offer real-time data regarding Earth’s weather systems. The Aqua mission measures all aspects of Earth’s water cycle in the solid, liquid, and gas states as well as global water temperatures, vegetation cover, and phytoplankton, which construct their shells from carbon dioxide and deposit that carbon onto the seafloor when they expire. The joint NASA and Argentin­ian Aquarius mission catalogs the salinity of Earth’s oceans, while NASA’s Aura mission monitors changes to Earth’s ozone layer. In collaboration with the German Aerospace Center, NASA supports the GRACE mission, which has observed a large drawdown of fresh water globally, from Northern Africa to the large agricultural San Joaquin valley in California.81 NASA and the French Space Agency together support the CALIPSO mission to track airborne particles or aerosols to determine their impact on global climate. These are only a handful of the varied and complex missions NASA supports in observing Earth’s biological, hydrological, and geochemical sys­tems. What we have learned from missions like these not only helps us to better understand climate change and its impact on life on Earth but also has prepared us to search for life on moons in the outer solar system and on exoplanets orbiting nearby stars. When telescopic detectors become sensitive enough, astrobiologists will scour the spectra of exoplanets light-years away searching for the biomarkers of oxygen or ozone, as these gases have no other sig­nificant source on Earth than its living organisms.

In 2006, on the thirtieth anniversary of the Viking Mission, Joel Levine, principal investigator of the proposed Mars Ares mission to fly a robotic plane over Mars to search for evidence of life, noted that scholars are still researching Viking’s nearly 60,000 im­ages, which remain “one of the most exciting, one of the most productive data sets we have ever obtained.”82 Venus and Mars, the closest worlds to Earth, retain their allure and mystery. Venus is a near twin of the Earth, our true sister planet, yet a runaway greenhouse effect has heated it to the point where life isn’t pos­sible. It’s a salutary reminder of what might happen if we don’t get our house in order in terms of carbon emissions. We wince and turn away. Mars, meanwhile, is the lightweight cousin of the Earth. In 2009, scientists at the India Space Research Organization (ISRO) reported having discovered thriving in Earth’s stratosphere three previously unidentified species of bacteria, despite consistent exposure to ultraviolet radiation that usually kills such organisms. Given that conditions in the Earth’s stratosphere closely resemble the atmosphere on Mars, the finding profoundly recalls Viking’s controversial experiments conducted on Martian soil decades ago. If there is biology on Mars, it leads a tenuous existence in hospi­table pockets below the surface. Until we definitively discover life, either on Mars or elsewhere, we invest these worlds with our full imagination, and project onto them our hopes, fears, and longings, anticipating the time when our isolation ends and we find compan­ionship in the cosmos—if only in a colony of microbes.

The Tireless Twins

Here are the basics of these twin long-distance explorers. The Voy­agers are nearly identical spacecraft, each weighing about 800 ki­lograms, the same as a very small car. The heart of each spacecraft is a ten-sided polygon which contains the electronics and which shelters a spherical tank holding the hydrazine fuel. The polygon is fronted by a ten-foot diameter high-gain antenna, which has kept communicating with the home planet even as it receded to a tiny

The Tireless Twins

Figure 4.1. The twin Voyagers used gravitational assist to exceed the Sun’s escape velocity and leave the Solar System. Despite its later launch, Voyager 1 reached Jupiter four months ahead of Voyager 2 due to a more direct path. Both spacecraft rendezvoused with Saturn, but only Voyager 2 had an encounter with Uranus and Neptune (NASA/Jet Propulsion Laboratory).

dot billions of miles away. Attached to one side of the polygon is a gold long-playing record; this apparent incongruity will be dis­cussed later. Voyager’s ten scientific instruments are attached to a couple of booms that extend away from the central polygon. The instruments include cameras and spectrometers, and there are de­vices for measuring magnetic fields, charged particles, cosmic rays, and radio waves. The video camera is based on a design devel­oped by RCA in the 1950s. That seems hopelessly archaic, yet the Voyager vidicons were very robust and they worked flawlessly.10 The mission cost $865 million through the Neptune encounter, and has been continuing on a dribble of funds as the spacecraft head beyond the Solar System. That works out to 5 cents per mile, cheaper than running a fuel-efficient car like a Toyota Prius. Ac­tual fuel efficiency is even better. Each launch vehicle had 700 tons of fuel; so far the Voyagers are getting about 80,000 miles per gallon!

Solar power is inadequate in the outer Solar System; too little radiation would reach the spacecraft. Voyager used an onboard power system called a Radioisotope Thermoelectric Generator, or RTG. Three of these were attached to a boom coming off the spacecraft. RTG’s had been used by the Vikings and the Pioneers previously, and subsequently they’ve been used by the Galileo, Ulysses, Cassini, and New Horizons spacecraft. Each RTG uses a fist-sized radiation source containing plutonium oxide to gener­ate heat, which is continuously converted into electrical current.11 Plutonum-238 (which is distinct from the Plutonium-239 that’s used in nuclear weapons) decays with a half-life of eighty-eight years. The Voyagers were getting 470 Watts of power at launch, but now they’re down to 250 Watts. That gentle decline in power is an inevitable consequence of nuclear physics, and as power has diminished, instruments have been switched off. In a few years, the gyroscopes will be shut down, and in the mid-2020s the Voyagers will go silent.

These are remarkable little spacecraft. Even though they are long in the tooth and obsolete by modern standards, they continue to generate scientific discoveries after thirty-five years. Think of it—they communicate at 160 bits per second, or a lower informa­tion rate than spoken speech and 25,000 times slower than “basic broadband” Internet service; they do their work with less than three light bulbs’ worth of power; and they’ve barely used half of their 220 pounds of hydrazine fuel after traveling 10 billion miles! On the Earth, 8-track tape decks and LP records have been relegated to yard sales; at the edge of the Solar System they’re still cutting edge. Moreover, the Voyagers are not too old to learn “new media” tricks. They have 25,000 followers on Twitter between them, with Voyager 2 being the more garrulous of the pair.

Ed Stone is the “father” of these middle-aged twins. Stone has had a storied career, serving as director of the Jet Propulsion Lab and chair of the Division of Physics, Mathematics and Astronomy at Caltech. He’s a Fellow of the National Academy of Sciences and winner of the President’s National Medal of Science and NASA’s Distinguished Service Medal. He also has asteroid 5841 named after him. Stone has been principal investigator for nine NASA missions, but the Voyagers hold a special place in his affections. He started working on the project in 1972; he’s now seventy-six, and he has no intention of retiring or slowing down. He intends to follow their progress all the way into the depths of interstellar space. In a 2011 interview, he allowed himself some introspection: “What a journey, what a thrill. . . . We were finding things we never imagined, gaining a clearer understanding of the environment the Earth was a part of. I can close my eyes and still remember every part of it.”12

Tools of the Swiss Army Knife

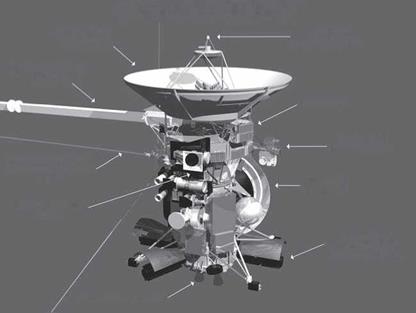
The Cassini orbiter has twelve scientific instruments and the Huy­gens probe had six. Tools on this “Swiss army knife” fall into three categories: remote sensing using visible light, remote sensing using microwaves, and studies of the environment near the spacecraft (figure 5.4). Despite using 13,000 electronic components and 10 miles of cable, each of the instruments has worked as planned. Many scientific studies use data from more than one instrument. The optical remote sensing instruments are all mounted on a pal­ette so that they face the same way. The main camera on Cassini is the Imaging Science Subsystem and it has been most people’s en­tree into the exotic world of Saturn and its moons. Carolyn Porco, the principal investigator of the instrument team, maintains a web­site loaded with amazing images and evocative descriptions.27 As noted earlier, she uses a Captain’s Log motif with affectionate al­lusions to Star Trek, and its clear she’s having the time of her life as Cassini images new worlds with unprecedented levels of detail. She’s compared a leadership role in a big space mission with child rearing—a journey of thrills and heartache, excitement and oc­casional disappointments, lasting twenty years or more. Even the most jaded cynic about big science would be entranced by the best pictures from the main imager.

Two mapping spectrometers look at the properties of Saturn, its moons, and its rings at optical and infrared wavelengths. This is the key to determining their composition and temperature. An ul­traviolet spectrometer does the same thing at shorter wavelengths than the eye can see, as another guide to chemical composition. Cassini can’t capture samples of the atmospheres or rings, so re­mote sensing with spectrometers is the best guide to chemistry. The

Tools of the Swiss Army KnifeCASSINI SPACECRAFT

Подпись:

Tools of the Swiss Army Knife Tools of the Swiss Army Knife

Low-Gain
Antenna (1 of 2)

445 N Engine (1 of 2) –

Figure 5.4. Cassini is a large and complex spacecraft about the size of a bus, with twelve scientific instruments, plus six on the Huygens lander. The instruments include cameras and spectrometers and others to measure magnetic fields, high energy particles, radio waves, microwaves. The power source is radioactive plutonium (NASA/Jet Propulsion Laboratory).

spacecraft’s microwave remote sensing instruments function a bit differently. Optical remote sensing just uses available light or radi­ation reflected from the planet, moon, or ring particle. Cassini has to generate its own radio waves and microwaves, send them to the target with a 4-meter high gain antenna at one end of the space­craft, then “listen” for a weak echo signal. The radar instrument can penetrate Titan’s atmosphere and so make topographic and compositional maps. It can also see deeper into the atmosphere of Saturn than any other instrument. The radio instrument looks for fine structure. It also makes Doppler measurements that allow the masses of Jupiter’s moons to be precisely calculated.28

A set of onboard instruments measure energetic particles, ions, and magnetic field strengths at the position of the spacecraft at any time. Here the complex orbital gymnastics are essential; to make a map of these properties the onboard instruments need to sample data from as many locations within the system as possible.

Several of the six instruments are devoted to understanding Sat­urn’s magnetic field via the charged particles that it often accel­erates. To avoid overspecialization, NASA selected six teams of interdisciplinary scientists. Their job is to use Cassini’s instruments in concert to maximize the learning and perhaps answer questions that hadn’t been anticipated. All this instrumentation is power – hungry and like other probes to the outer Solar System, there isn’t enough sunlight for solar panels, so Cassini uses 72 pounds of Plutonium.

LIVING WITH A RESTLESS STAR

Imagine you woke up one morning and your planet had been engulfed by the atmosphere of a star. High-energy particles slam into the atmo­sphere, creating shimmering auroras. Sunspots flicker, each one re­leasing more energy than the largest atomic bomb. Great loops of hot gas uncoil from the star’s surface, extending millions of miles. Each whip crack of activity causes mayhem on orbiting satellites, frying their circuit boards and wreaking havoc on their guidance systems. Your planet is assailed by high-energy particles traveling at nearly the speed of light. Looking at the star, its emission doesn’t change detectably from day to day or year to year, but its invisible short wavelength radiation fluctuates wildly and unpredictably.

Where is this place? It’s the Earth, and the star is the Sun. This activity isn’t because the Sun has run out of nuclear fuel and has turned into a red giant; our star is in the dull middle age of its life. But the clean, crisp edge the Sun seems to have in the daytime sky is an illusion. That curved surface—the edge of the photosphere— corresponds to a place where the gas of the Sun has thinned out to the point where photons no longer careen into particles and they can travel freely.1 From that point they travel in straight lines with­out interruption, streaking to the Earth in eight minutes. Inside the photosphere, which is a slender sheath thinner than the skin on an apple compared to its radius, the Sun is opaque and our view is blocked. We see the boundary layer as having a sharp edge, just like a cloud has a well-defined edge.2

The edge is an illusion because there’s no physical surface or barrier. If you could penetrate the Sun in a spaceship, you’d feel no bump. The material of the Sun extends much further into space than its visible edge. In its physical quantities of temperature, pres­sure, and density, the Sun varies continuously and smoothly from its fusion core outward. It possesses a surprising multi-million – degree corona, the influence of which extends past the Earth’s orbit almost to the edge of the Solar System. Invisible forms of high-energy radiation and subatomic particles—ultraviolet waves, X-rays, gamma rays, and relativistic cosmic rays—streak toward us and past us at the speed of light. In a very real sense, we live “inside” the atmosphere of an active star, with profound and sur­prising consequences for life on Earth.