MAPPING THE MOON
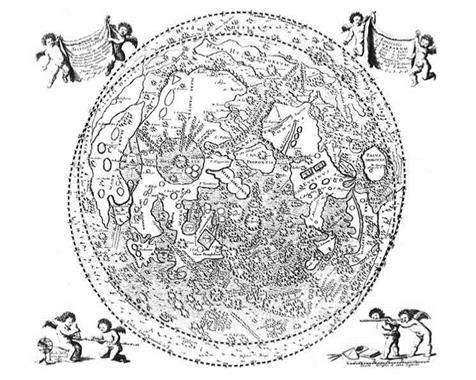
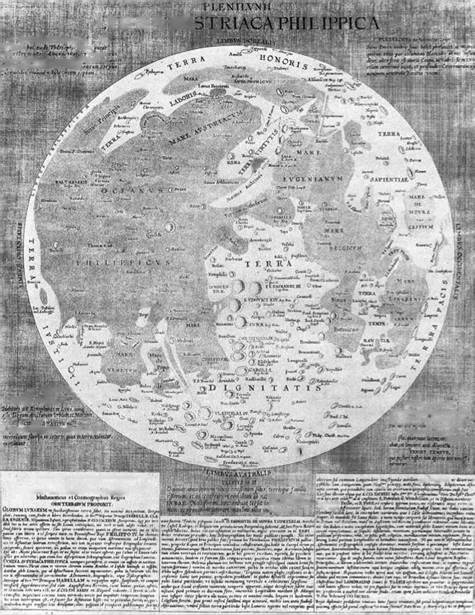
Jacob Floris van Langren founded a business in Amsterdam in 1586 which made globes, and as Dutch explorers reported discoveries he could barely keep up with the demand for updates. In 1627 his grandson, Michel van Langren, observed the Moon and made a sketch. After moving to Madrid as Court Astronomer to King Felipe IV of Spain in 1630, the grandson convinced the King that tables listing the sunrise and sunset times of specific lunar features would enable the time at the observing site to be determined, which would in turn solve the ‘longitude problem’. The prerequisite was a map of the Moon. In 1643, having made 30 sketches, van Langren realised he had competitors, so in 1645 he issued a whole-disk map 34 cm in diameter on which he named 325 features after prominent philosophers, mathematicians, astronomers, explorers, religious figures and (recognising his sponsor) members of the Spanish royal family. However, at that time the revolt of Protestantism which would later be called the Thirty Years War was well underway, and a nomenclature drawn from Catholic Europe was sure to be contentious.[2]
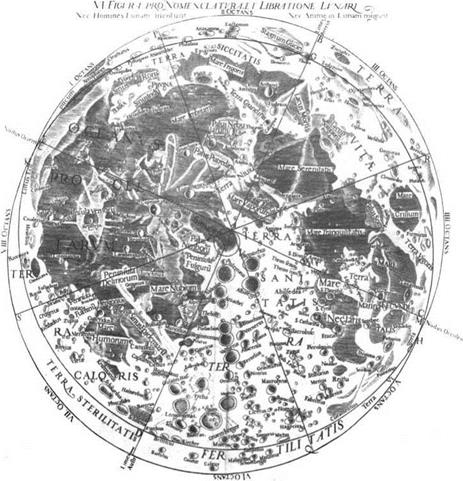
In 1637 Pierre Gassendi, a mathematician in Paris, also came to the conclusion that it should be possible to use observations of the Moon to determine the time and thereby resolve the ‘longitude problem’. After he had made some drawings, he heard that Johann Hevelius, whom he had once met, was starting to make a map, and upon seeing the quality of the younger man’s sketches Gassendi stopped and handed over his own work. A city councillor in Danzig in Poland, Hevelius built an observatory on the roof of his house and installed a telescope with a 5-cm-diameter lens, a focal length of 3.6 metres and a magnification of 50 – in fact, one of the best telescopes of the time. In 1647 he published Selenographica sive Lunae Descriptio, with fine drawings and a consolidated map 30 cm in diameter.[3] He named 275 features after terrestrial landforms, including oceans, seas, bays and lakes – although he realised there were no bodies of open water. Like Galileo, Hevelius estimated the heights of the lunar peaks by their shadows, but much more accurately. Being a Protestant, his nomenclature had little in common with that of van Langren. In fact, Hevelius had presumed himself to be the first to name features, and said the task was arduous. He
 Ш7^ f
Ш7^ f

![]()
ШІІІ »Г«Ш л*1" V«…
‘ Піт.
Д-U^li iM ЛкЖсЛіШІ »Wfca«£e ■
ши: ГОфАМ WUJA ГЛд»>Т1П TAMES SVXASO
мшмліичшоуіампіА.
MICHAEL TLORENTIVe. LANGRENVS
The map of the Moon published by Michel van Langren in 1645 was the first to assign names to features.
|
A map of the Moon published by Johann Hevelius in 1647. |
honoured astronomers and scientists, including Gassendi, but not himself. However, only a dozen of his names have survived.
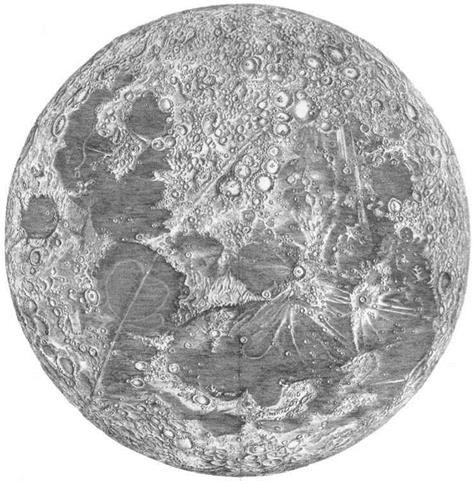
As a Jesuit professor of astronomy and theology at the University of Bologna, Giovanni Battista Riccioli believed implicitly in the Aristotlean system as written of by Ptolemy. In an effort to counter the growing belief that Earth travels around the Sun, he set out to write an authoritative account of astronomy. But while developing his argument he came to suspect he was wrong! He could never admit this publicly, however. In 1651 he published Almagestum Novum, with a whole-disk map of the Moon that was 28 cm in diameter and was based on observations made by his pupil, Francesco Maria Grimaldi. Although the map was little better than that by Hevelius, its historical significance was the nomenclature. This retained oceans, seas and bays for the dark areas, but renamed them for states of mind: e. g. Oceanus Procellarum and Mare Tranquillitatis. Craters were named after astronomers and philosophers, including Riccioli and Grimaldi. The despised Copernicus was assigned a crater in Oceanus Procellarum – the Ocean of Storms. To Helvelius’s frustration, soon copies of his map were in circulation relabelled with Riccioli’s nomenclature! Nearly all of the 200 names introduced by Riccioli and Grimaldi are still in use today.
Giovanni Domenico Cassini was born in 1625 in the Republic of Genoa. After a Jesuit education he was hired by the Marquis Cornelio Malvasia in Bologna, who
|
A map of the Moon published by Giovanni Battista Riccioli in 1651. |
derived ephemerides for astrological purposes. Utilising the excellent instruments of his employer’s observatory, Cassini made observations of exceptional precision and quality, and in 1650 became professor of astronomy at the University of Bologna. In 1666 plans were initiated to establish a national observatory in Paris, and in 1669 Cassini, now with several significant discoveries to his name, was invited by King Louis XIV to become its first director; he accepted and promptly moved to France to oversee the construction of the observatory, which was finished in 1671. In 1679 he published a map of the Moon which, at 52 cm in diameter, was much larger than its predecessors. Although very accurate, so few copies were made that it did not gain the attention which it warranted.
Meanwhile, Isaac Newton at the University of Cambridge in England had made a study of gravity and, contrary to the accepted wisdom that it remained constant
|
A map of the Moon published by Giovanni Domenico Cassini in 1679. |
with distance, realised that its strength declined with the inverse square of distance. His book Philosophiae Naturalis Principia Mathematica, published in 1687, provided a basis for the laws of planetary motion that Kepler had derived empirically.
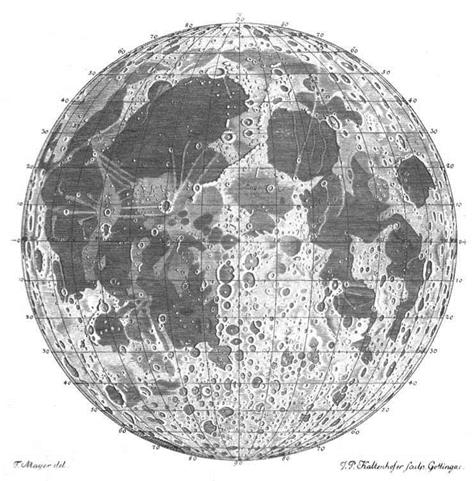
The Moon was essentially ignored for a century, then Tobius Mayer in Germany became interested in its use in relation to the ‘longitude problem’. In 1751 he gained the chair of economics and mathematics at the University of Gottingen, where, a few years later, he became superintendent of the observatory. As a skilled draughtsman, he utilised a micrometer to measure the geographical positions of the lunar features. His map was published posthumously in 1775, and although only 20 cm in diameter it was the first to include lines of latitude and longitude. It superseded the map by Hevelius (re-annotated with the nomenclature of Riccioli) which had been standard for almost 150 years, and would itself not be surpassed for half a century.
|
A map of the Moon by Tobius Mayer that was published posthumously in 1775. |
William Herschel, who discovered the planet Uranus in 1781 and became the first president of the Royal Astronomical Society, did not devote much attention to the Moon. However, he believed it to possess an atmosphere (even though the way stars were occulted contradicted this) and active volcanoes. Although by now the idea of open water had been abandoned, Herschel was “absolutely certain” the Moon was inhabited.
Johann Hieronymus Schroter was born in 1745 in Erfurt in Germany. In 1767 he graduated in law from the University of Gottingen. In 1781 he moved to Lilienthal, near Bremen, to become chief magistrate. Having been inspired by Mayer’s map, he built an observatory alongside his house and installed a series of ever more powerful telescopes. Over a period of 30 years he made hundreds of detailed drawings of the Moon, recording individual features under different angles of illumination. In this respect, he founded modern selenography. He paid particular attention to craters and
rilles – both of which terms he introduced. His measurements of the heights of lunar peaks were better than those of his predecessors. Although an accurate observer, he was not a skilled draughtsman and utilised a ‘schematic’ style. In 1791 he published Selenotopographische Fragmente zur genauern Kenntniss der Mondflache in two volumes containing a total of 75 engravings. He did not consolidate his observations into a full – disk map, but did include an enlarged version of Mayer’s map. In 1813 the invading Napoleonic army ransacked and destroyed his observatory, and most of his unpublished work was lost. Schroter inferred the Moon to have an atmosphere, but estimated its pressure to be less than that of the best vacuum pump available at that time. Nevertheless, like Herschel, he believed the Moon to be inhabited.
Wilhelm G. Lohrmann was a surveyor in Dresden, and a skilled draughtsman. He had developed a keen interest in astronomy as a boy, and in 1821, aged 25, began to study the Moon. He set out to make a map in 25 sections on a scale at which the disk would be 95 cm in diameter. By 1824 he had released the first four sections, and by 1836 had the drawings for the remaining sections, but then his eyesight failed and he was unable to finish the editing. Nevertheless, in 1838 he published a full-disk map at 40 per cent scale.
Johann von Madler was born in 1794 and became a teacher in Berlin. One of his students, the wealthy banker Wilhelm Beer, was only a few years younger and they became friends. In 1829 Beer built an observatory at his house and bought a 95-mm – diameter refracting telescope produced by Joseph von Fraunhofer’s firm. Beer hired Madler as observer, and they measured almost 1,000 features to trigonometrically survey the Moon. Between 1834 and 1837 they published Mappa Selenographica in four parts, which together made a whole-disk map 95 cm in diameter. Owing to the recent improvement in telescopes, their map surpassed all its predecessors. In 1838 they republished the map with a dissertation in their book Der Mond. It became the definitive work on the subject, but their convincing argument for the Moon being an airless and unchanging body prompted a hiatus in observing.
While reading Schroter’s 1791 Selenotopographische Fragmente as a boy, J. F.J. Schmidt in Germany decided to study the Moon. After acting as assistant at various German observatories, in 1858 he became director of the Athens Observatory and set out to make a full-disk map with a diameter of 180 cm which would show more craters, rilles and mountains than its predecessors. In fact, for many years he was the only observer engaged in systematic lunar work! He completed the observations in 1868, having produced in excess of 1,000 sketches, measured the positions of over 4,000 points, catalogued 278 rilles and used shadow details to measure the depths of craters and the heights of mountains. When issued in 25 sections in 1874, the map specified 33,000 craters and the heights of 3,000 mountains. In 1878 he reprinted it in his book Charte der Gebirge des Mondes. Having acquired Lohrmann’s files, Schmidt had his predecessor’s map engraved at the scale originally intended, and in 1878 published it as Mondkarte in 25 Sektionen; it would have been a fine map for its time, but was now obsolete.
In 1864 the British Association established a Lunar Committee, but this achieved little. In 1876 Edmund Neville Nevill (using the surname Neison) published a book, The Moon, which included a full-disk map in 22 sections with a diameter of 60 cm. In fact, it was a reworking of Beer and Madler’s chart supplemented with a detailed description of each named feature – some 500 in all – making it a monumental work. It stimulated sufficient interest to prompt the establishment of the Selenographical Society with William Radcliffe Birt, one of the most active of British amateur lunar observers of that time, as president, and Neison as secretary. But it was disbanded in 1883 after the death of Birt in 1881 and the departure of Neison in 1882 to become the first director of the Natal Observatory in Durban in South Africa. Nevertheless, when the British Astronomical Association was established in London in 1890 the former members of the Selenographical Society set up a Lunar Section as a means of coordinating their activities. T. G. Elger, the Director of the Lunar Section, published a book entitled The Moon in 1895 to assist new observers.
By 1890 photography had matured sufficiently to facilitate surveys of the Moon. Two photographic atlases were published in 1897. Atlas Photographique de la Lune covered the whole face in many small sections using plates taken by Maurice Loewy at the Paris Observatory and text provided by his assistant Pierre Puiseux. The Lick Observatory Atlas of the Moon by Edward Singleton Holden comprised 19 sheets of reproduced photographs. After establishing a temporary astronomical outstation in Jamaica, W. H. Pickering of the Harvard College Observatory set himself the task of photographing the lunar disk in several sections at five illumination phases. When The Moon – A summary of existing knowledge of our satellite, with a complete photographic atlas was published in 1903 it was the first true atlas, because the pictures were reproduced at the same scale. Although Jamaica had particularly clear skies, Pickering’s pictures of the Moon were still blurry and so there remained scope for visual studies, particularly in the limb regions – but as professional astronomers turned their attention to the stars and even more distant objects, they left the Moon, which they regarded as a source of ‘light pollution’, to their amateur brethren.
On the nights of 12 to 15 September 1919 Francis Pease photographed the Moon while testing the new 100-inch Hooker reflector at the Mount Wilson Observatory in California. Walter Goodacre was born in 1856, lived in London, and developed an interest in astronomy as a boy. In 1910, after making thousands of observations, he compiled a whole-disk map of the Moon almost 200 cm in diameter. In 1931, by which time he had replaced T. G. Elger as Director of the Lunar Section of the British Astronomical Association, he published The Moon. It featured a map which combined fine detail obtained by visual observing in good ‘seeing’, with positional accuracy derived from the Mount Wilson photographs, but few copies were issued.
The International Astronomical Union was established in 1919 to oversee general issues, and it took responsibility for regulating lunar nomenclature.


