GENERATING NEW KNOWLEDGE, 1946-1948
With the end of the war, research on supersonic aerodynamics, both theoretical and experimental, began in earnest. Despite the daunting uncertainties of flight through the speed of sound – “breaking the sound barrier” in the popular terminology – the newly available jet and rocket engines made supersonic flight at least imaginable. A feeling prevailed among research managers and research workers alike that the time had come for serious study of supersonic problems. My own work at Ames in the period discussed here was in the new 1- by З-ft Supersonic Wind Tunnel Section, where I engaged primarily in wind-tunnel experiments and in comparison between experiment and theory. At the same time, a great deal of theoretical work was going on in other parts of the laboratory. I shall discuss our group’s activities under the same headings as before.
Theory – To design supersonic aircraft, airfoil theory, however accurate, would hardly be sufficient; actual airplanes have finite-span wings. Because of the threedimensional complexity of such problems, little could be hoped for here beyond a linear theory, which in effect assumes small disturbances from the free stream and hence thin wings at small angles of attack. Fortunately, physical concepts and mathematical tools for such linear approximation had long been established from study of acoustic phenomena and the associated wave equation. With potential utility as motivation, a vast three-dimensional extension of Ackeret’s twodimensional linear theory of 1925 appeared in the last half of the 1940’s. In this rapid growth, duplication was inevitable within and between aeronautically advanced countries. Here I deal only with work having direct bearing on our study at Ames.
Initial influence on our thinking came from the findings of Robert Jones of the NACA and Allen Puckett of the California Institute of Technology. Jones, working at the NACA’s Langley Aeronautical Laboratory in Virginia and using a linear approach of his own devising, was first in the United States to conceive (in early 1945) of the beneficial effects of wing sweepback at high speeds. He continued to elaborate his exciting and original ideas at Langley and after moving to Ames in August 1946. Puckett, working at about the same time, used a method employed on bodies of revolution in the early 1930’s by Theodore von Karman and his Caltech student Norton Moore. At Karman’s suggestion, Puckett extended this method to the zero-lift drag of triangular wings, with special attention to the influence of the sweepback angle of the leading edge and the chordwise location of maximum thickness. His results attracted considerable notice when presented at an aeronautical meeting in New York in January of 1946. Developments such as these could not help but catch the attention of the Ames Theoretical Aerodynamics Section under Max. Heaslet; and he, Harvard Lomax, and their coworkers were soon adding to the flood of linear theory. A body of potentially useful theory was thus appearing just as experimental work was beginning in earnest.9
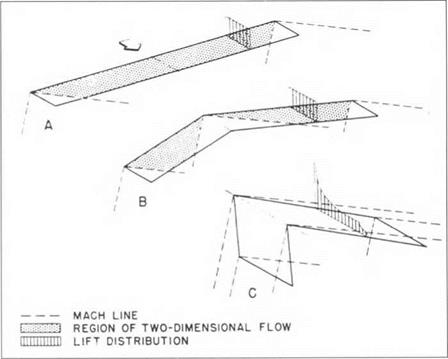
Qualitative concepts from the linear theory are important for our later comparisons. Figure 3 concerns the behavior of three flat lifting surfaces of representative planform (such surfaces being sufficient for our general points). Instead of propagating upstream and throughout the field as in subsonic flow, the pressure signal from a disturbance in a supersonic flow is confined, in the linear approximation, to the interior of a “Mach cone” – a circular cone with axis aligned with the free stream and apex angle a decreasing function of the free-stream Mach number M0. In the figure, the trace of significant Mach cones in the plane of the lifting surfaces at a fixed M° is shown by the dashed lines. We see that the effect of the tips on the straight wing A is confined to small triangular regions beginning at the leading edge. The remaining, dotted region of the wing is, so to speak, unaware
|
Fig 3. Flat lifting surfaces in supersonic flow according to linear theory. |
of the presence of the tips, and has the constant fore-and-aft lift distribution characteristic of two-dimensional flow (compare, for example, the uniform vertical distance between the linear-theory curves for the upper and lower surfaces in figure 2). On the moderately swept wing В in the figure, the additional effect of the wing root is, like that of the tips, confined to a finite region aft of the leading edge. It turns out that the flow in the dotted region is again effectively two-dimensional and the lift distribution correspondingly constant. The highly swept wing – has its leading edge entirely within the region of influence of the wing root, and no regions of twodimensional flow exist. Interestingly, the lift distribution here turns out to be similar in its general features to that given by linear theory in two-dimensional swisonic flow – infinite at the leading edge and decreasing to zero at the trailing edge. Though the linear behavior of figure 2 is approximate, there was reason to believe that the nonlinear inviscid situation would be at least qualitatively similar.
Experiment – The mid-1940s saw construction of numerous supersonic wind tunnels in the United States and other countries. The considerable and demanding complexity of supersonic as compared with subsonic tunnels can be found described elsewhere.10 The Ames supersonic tunnel, construction of which began in 1944, was a closed-return, variable-pressure facility powered by centrifugal compressors totaling 10,000 horsepower. These characteristics and its 1-foot-wide by 3-foot-high test section made it the NACA’s, and one of the country’s, first supersonic tunnels of adequate size and versatility for comprehensive aerodynamic testing. Design of the tunnel drew on findings from smaller experimental tunnels at Caltech and the NACA’s Langley Laboratory, small-scale tests of our own, and the little we knew of the tunnels at Zurich and Guidonia. (Our knowledge of these was not as great as it could have been, thanks to the limited attention given in the United States to the proceedings from the Volta conference. Existence of the more advanced tunnels at Peenemtlnde was still unknown.) I participated in design of the tunnel and was assigned supervisory responsibility for it and the activities of the 1- by З-ft Wind Tunnel Section when operation began in late 1945.11 The group, typical of a wind-tunnel staff at Ames, numbered around 35 people, of which 20 or so were research engineers.
Just as theoretical work requires mathematical techniques, experiment requires instrumentation. To measure forces on a model in the new tunnel, our group developed a new support and balance system that simplified such arrangements. This system supported a model from the rear on a slender rod (a “sting”) attached to a long, slender, fore-and-aft beam. The beam in turn was supported inside a housing that shielded it from the airstream and that could be adjusted angularly by an electric drive to change the model’s angle of attack. Motion of the beam in relation to the housing was constrained by small, stiff cantilever springs equipped with electric – resistance strain gages. These tiny gages, which had only recently been invented for structural testing, were made of a back-and-forth winding of fine wire cemented to the springs; they measured the deflections of the springs and hence the forces on them by measuring the change in electrical resistance of the wire as it was stretched by the deflection. The forces on the springs could then be used to calculate the forces on the model. It was the strain gages, in fact, that made a compact system interior to the tunnel feasible. As often happens, advance in one area of technology – structural testing – thus made possible advance in a very different one – supersonic experiment.
The wing tests in 1946-47 constituted the third and most extensive experiments thus far in the new tunnel. The move to test wings in relation to theory required approval, though hardly direction, from Ames management; with the body of theory then appearing, it was clearly the thing to do. In planning the tests, my prime concern was to explore a wide range of planforms while keeping the number of tests and accompanying theoretical calculations within doable bounds. In the end, I settled on 19 wings varying systematically in sweepback angle, taper ratio (ratio of tip chord to root chord), and aspect ratio (ratio of span to average chord). The airfoil section for most of the models was an isosceles triangle with a height of five-percent of the base (the airfoil chord). The sharp leading edge, a marked departure from the blunt edge employed for subsonic flight, was known to have advantages at supersonic speeds for platforms of moderate leading-edge sweep. The isosceles – triangle section was chosen primarily to facilitate construction, the flat bottom making for easy mounting for machining. As it turned out, the cambered section brought to light some interesting, if secondary, results that would not have been encountered with an aerodynamically simpler uncambered section. At the time of the tests, the planned adjustable wind-tunnel nozzle needed to vary M0 at supersonic speeds had not been finished, and all measurements were made in a fixed nozzle at M0 = 1.53. The free-stream Mach number for the tests was thus not a variable.
A reader of my book What Engineers Know… will recognize the scheme of testing just described as an example of the method of parameter variation, which I examined in connection with the Durand-Lesley propeller studies at Stanford University. This method can be defined in general as “the procedure of repeatedly determining the performance of some material, process, or device while systematically varying the parameters that define the object of interest or its condition of operation.”12 In the Durand-Lesley work, the variable parameters were five quantities that defined the complex shape of the propeller blades, plus two quantities – the speed of the airstream and the speed of rotation of the propeller – that defined the condition of operation. In the present tests, the geometrical parameters were the three planform quantities mentioned above (supplemented by a few individual planforms and airfoil sections); the single operational parameter was the wing’s angle of attack relative to the airstream. Engineers employ such experimental parameter variation widely to supply design data in situations where theory is unavailable, unreliable, or, for one reason or another, impractical to apply. It is also employed extensively, as here, in engineering research. The method has been used so much and for so long that it has become second nature to engineers. It had been constantly before me in my student days at Stanford in the collection of Durand-Lesley propellers mounted on the wall of the wind-tunnel laboratory; at the NACA it was embedded in the culture. I and my colleagues would never have thought of it at that time as a formal method nor felt the need to give it a name.
As usual in NACA wind-tunnel studies, a team of research engineers – in this case about ten – carried out the work. The team included test engineers running the experiments on a two-shift basis, a specialist responsible for the functioning of the new, still troublesome balance system, and an engineer who monitored the day-today reduction of the data to standard form. The numerical calculations for the last operation kept four or five young women busy operating electrically driven Friden mechanical calculators, the usual practice before the advent of electronic computers. Two additional engineers did the then difficult calculations of wing characteristics according to linear theory and analyzed the results in comparison with the experiments. The members of the team occupied the same or adjacent offices and exchanged experience and suggestions as part of their daily interaction. My own task, besides planning the research, was to oversee the operation, participate closely in the analysis, and handle much of the final reporting. Robert Jones, though not assigned formally to the l-by-3 Section after his move from Langley, occupied an office across from mine, and we talked regularly. Since few people had training in supersonic aerodynamics at that time, work such as ours tended to be a young person’s game; at 29,1 was the oldest in the Section and one of two with a graduate degree – a two-year Engineer’s degree for me and a one-year Master’s degree for the other. We learned as we went.
Though the planning had been exciting, running the tests and reducing the data were characteristically tedious. To carry out the tests, an experienced engineer operated the wind tunnel and other equipment, while a junior engineer recorded the meter readings from the strain gages. Though sitting side by side, they communicated by microphones and head sets because of the roar of the wind-tunnel compressors. The models could be seen through circular access windows in the sides of the tunnel’s test section, as was found useful for the boundary-layer observations to be described later. Two mechanical technicians prepared models for subsequent tests and took care of the trouble shooting and repair needed in those early years of the equipment’s operation. Reduction of the data by the young women required long hours of repeated calculations to fill the many columns of numbers leading to the standard forms (see below). Their supervising engineer, besides helping organize their effort, plotted the results in a uniform layout, sometimes detecting discrepancies that called for recalculation or retesting. A shared sense of purpose and the fact that there was no other way – plus a good deal of humor and give-and-take – made the tediousness of all this tolerable.
Intellectual excitement reappeared in the theoretical calculations and in the analysis of the results. The theoretical computations called for considerable mathematical skill and ingenuity in an area that was only then developing. The engineers doing the task kept in close touch with the people in the Theoretical Aerodynamics Section who were contributing to that development. As our work progressed, they made ongoing comparison, where possible, between the emerging theoretical findings and our accumulating test results. For my part, I looked in on the wind-tunnel testing when I could, making occasional suggestions. I also struggled to keep abreast of the theoretical work, especially the resulting comparisons, and once or twice a week I reviewed the accumulating data plots, looking especially for questionable results that might call for retesting. The entire activity was less rigidly organized than this account may sound, with much improvization and a great deal of back-and-forth suggestion. To keep my review of the plots from being interrupted by other duties, I regularly took refuge in an unused upstairs room, leaving instructions with my secretary that I was not to be bothered by phone calls or otherwise. When the laboratory’s director telephoned one day, she refused to put him through; the sharp reaction caused me to add an exception to my instructions.
All work in our tunnel, including the wing study, came up for discussion in Friday-aftemoon meetings between myself, the two engineers doing the theory, and the project engineers of two or three concurrent studies. These meetings led to vigorous and contentious, though friendly, debate. Although we did not think of it that way at the time, we were learning and educating each other in the complexities of supersonic aerodynamics, a field in which few people could claim broad knowledge.
I do not suggest that we were alone in the learning process. Experimental and theoretical study of supersonic flow grew rapidly at various laboratories in the period in question. In the year before the present work, researchers at the Langley Laboratory ran “preliminary” tests in their 9-by-9-inch experimental tunnel of eight triangular planforms of varying apex angle plus six sweptback wings; the lift for the triangular wings they compared with a limiting-case linear theory valid for small apex angles.13 The efforts of our team provided the first extended comparison of experimental results for symetrically related wings with calculations from the full linear theory.
Comparison – The results of the study appeared in three detailed reports (originally confidential, later declassified) in late 1947 and mid-1948.14 The plots reproduced here are taken from a later summary presentation. The sampling is a limited one, chosen to highlight the relationship of theory to experiment.
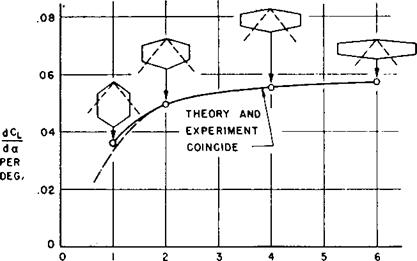
Variation of lift with angle of attack normally follows a straight line, both experimentally and theoretically, at the low angles useful in practice. Figure 4 gives the measured and theoretical slope of these lines for four unswept wings of varying aspect ratio. (Lift is the upward force perpendicular to the direction of the free stream. The quantity CL on the vertical axis is a dimensionless measure of lift.) The wings, illustrated by the sketch with each test point, had a common taper ratio of 1/2; each sketch shows the trace of the Mach cone from the forwardmost point of the wing. In this and later figures, results from linear theory were provided over as wide a range as was possible at the time.
The agreement between experiment and theory is seen to be excellent – too good, in fact, to be strictly true. The theory neglected viscosity and applied to the wing alone; the experiment took place in a viscous gas and involved aerodynamic interference from the slender body needed to support the model (illustrated later in figure 10). It seemed likely that these effects, probably small in the case of lift, just compensated for this family of wings. The theoretical reduction in lift-curve slope at
|
M0 = 153 EXPERIMENT ———- LINEAR THEORY (WING ALONE)
ASPECT RATIO, A |
Fig 4. Effect of aspect ratio on lift-curve slope.
low aspect ratios comes from a loss of lift within the Mach cones that originate at the leading edge of the wing tips; as the aspect ratio decreases, a greater fraction of the planform falls within these Mach cones, with resulting decrease in the calculated lifting effectiveness of the wing. The agreement of theory with experiment implied that such theoretical decrease in fact occurred.
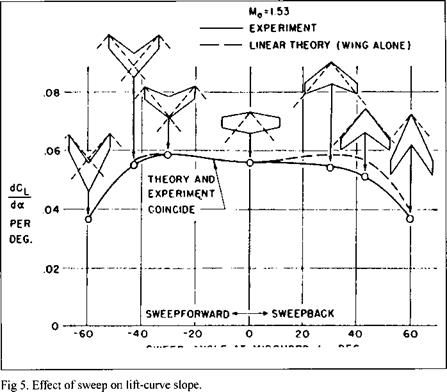
The effect of sweep on the lift-curve slope appears in figure 5 for seven wings, also of taper ratio 1/2. The sweep angle in all cases was measured at the midchord line; the wing of 43E sweepback was chosen to have its leading edge coincident with the Mach cone at M0=1.53. A swept-forward wing in each case was obtained from the corresponding swept-back wing by reversing the model in the support body.
The theoretical results proved symmetrical about the vertical axis between ±43°. Such symmetry had been predicted analytically for certain classes of wings, though not the kind here. Shortly after our reports were written, this initially surprising “reversibility theorem” was verified with complete generality, so the theoretical curve could have been extended to -60°. The departure from symmetry in the experimental results was conjectured to be due to aeroelastic deformation, present in the experiments but absent from the theory. Such deformation increases the angle of attack of sections near the wing tips for forward portions of sweptforward wings and decreases it for rearward portions of sweptback wings;
|
|
this difference changes the lift in opposite directions, increasing it for sweptforward wings and decreasing it for sweptback. Again, compensation of secondary effects, this aeroelastic deformation plus the two previous ones, was thought to play a role in the almost perfect agreement between experiment and theory for sweepforward.
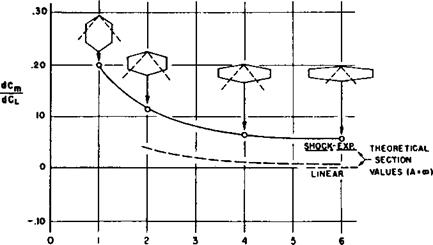
Validity of linear theory in predicting lift must not be taken to imply validity in the prediction of lift distribution. This can be seen in the two-dimensional results of figure 2. The total lift, as indicated by the area between the upper – and lower-surface curves, is given very closely by linear theory in comparison with nonlinear shock – expansion theory, and, to a somewhat lesser degree, with experiment. The shock-expansion and experimental distributions of lift, however, are concentrated noticeably more toward the leading edge. As a consequence, the corresponding centers of lift are forward of the midchord location given by the uniform linear distribution, somewhat more so in the case of experiment thanks to the shock-wave, boundary-layer interaction near the trailing edge.
Observations of this kind helped explain the results of figure 6 for the family of unswept wings. The quantity on the vertical axis (whose strict definition is immaterial here) can be shown to be a close measure of the displacement of the center of lift forward of the geometric centroid of the planform (midchord at midspan for the present wings). Here, as a result again of the loss of lift within Mach cones (not illustrated) at the tips, which would be larger toward the trailing edge, linear theory shows a progressively forward displacement as the aspect ratio A is reduced. In the opposite direction, in the limit of infinite aspect ratio (A x 8), the tips disappear and the flow over the wing becomes entirely twodimensional; the theoretical curve must accordingly approach the linear section value of zero (i. e., midchord, cf. fig. 2) in that limit, as indeed it appeared to do. Similarly, if a theoretical curve could be calculated over the entire range of A by a three-dimensional equivalent of the shock-expansion theory, it would have to approach (cf. again fig. 2) a limit forward of midchord; the calculated value for the present isosceles-triangle section is shown in the figure. The fact that the experimental curve appeared to be approaching an asymptote somewhat above this value was consistent with the presence of shock-wave, boundary-layer interaction as before. We inferred therefore that the departure here of experiment from linear theory for all aspect ratios (despite the agreement for overall lift) came from nonlinear pressure effects and shock-wave, boundary-layer interaction through their joint influence on chordwise lift distribution. We were here doing what engineers often find necessary – using experience from a simpler and hence more theoretically analyzable case to interpret (and sometimes
|
M0- 1.53 EXPERIMENT ———- LINEAR THEORY (WING ALONE)
ASPECT RATIO, A |
Fig 6. Effect of aspect ratio on position of center of lift.
|
|
anticipate) the problems encountered in applying a necessarily more approximate theory to a more complicated case.
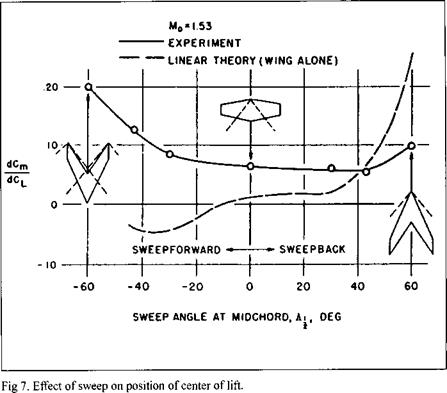
That even this may not be possible is illustrated by figure 7 for the center of lift of the swept wings. The unswept wing here is the aspect-ratio-4 wing of figure 6, for which the departure of experiment from theory was reconcilable as above. The complete disagreement in variation with angle of sweep, however, could not be reconciled on the basis of existing knowledge. Experimental studies of sweep at subsonic speeds had indicated major effects of viscosity on lift distribution, particularly at high sweep angles. Nonlinear pressure effects, however, could not be discounted here. Differences in elastic deformation between forward and backward sweep could also have greater influence on center of lift than on lift itself. As often happens with initial exploration into a new field, the findings here raised more questions than they answered.
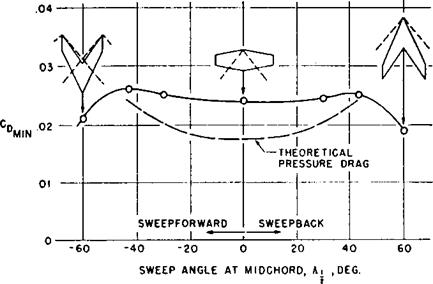
Drag, the force parallel to the free stream, is influenced in a major way by viscous friction on the wing surface. Here a sampling of drag at the small angle of attack at which it is a minimum will serve our purpose. Figure 8 gives a dimensionless measure of this minimum drag for the family of swept wings. The theoretical pressure drag, like the lift-curve slope, proved symmetrical with regard to sweep
|
M0* 1.53 EXPERIMENT ———- LINEAR THEORY(WING ALONE)
Fig 8. Effect of sweep on minimum drag. |
angle over the range between ±43° within which drag calculations were then feasible. This was in keeping with a then recently proven theorem. The expectation (later confirmed) was that the theoretical curve, when continued, would reach its maximum for sweep in the vicinity of the Mach cone and then fall off with further sweep, again symmetrically. The experimental results showed just such overall behavior, though in view of the complexities likely to arise from viscosity and support-body interference, the near perfect symmetry here came as a surprise. The experimental – like the theoretical – fall off at high sweep, however, was expected, in keeping with Jones’s ideas and with what experimentalists were finding, by “stopgap” methods of varying accuracy, at supersonic and high subsonic speeds. With regard to viscous drag, the experimental point for zero sweep showed a reasonable increment beyond the theoretical pressure drag, tending to confirm the theory in this situation. Disappearance of this increment with increasing sweep in either direction, however, suggested that linear theory overestimates the pressure drag for sweep near the Mach cone. All we could do here was to point out the similarity to the then puzzling situation in two-dimensional transonic flow, where the pressure drag from linear supersonic theory becomes unreasonably high (in fact, rises without bound) as the free-stream Mach number approaches 1 from above. The similarity was supported by the fact that at free-stream Mach numbers above 1, the Mach number of the velocity component normal to the Mach cone, which coincided with the leading edge of the wing for sweep of ±43°, is likewise 1. (The difficulty in the two-dimensional case was indeed shown soon after to be due to nonlinear transonic effects inaccessible to linear theory.)
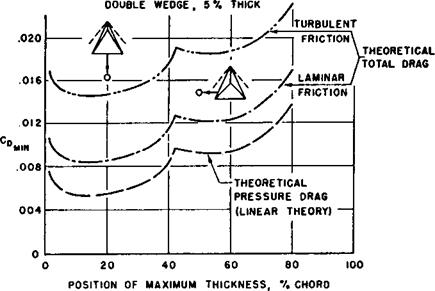
The most significant results concerning drag, however, dealt with that of triangular wings. A reason for the notice given Puckett’s theoretical work appears in the lower curve in figure 9, which shows how the minimum pressure drag of a triangular wing with uncambered double-wedge section and leading edge inside the Mach cone varies as the position of maximum thickness is altered. Results of this kind suggested that the drag of such wings could be lowered significantly by placing the position of maximum thickness (i. e., the ridge line of the double wedge) well forward on the wing. To assess this encouraging finding, our tests were extended to include the two triangular wings shown by the sketches, one with maximum thickness at 50-percent chord, the other at 20-percent.
As indicated by the small circles, the experimental measurements did not come out as hoped; the 20-percent location, in fact, gave a slightly higher drag than the 50-percent. Repeated tests showed that experimental error could not be blamed, and theoretical estimates indicated that support-body interference could hardly
|
M0* 1.53 section: uncambered
|
Fig 9. Effect of position of maximum thickness on minimum drag of triangular wings.
account for the large increment above the pressure drag for either wing. Consideration of viscous friction finally suggested an explanation. As always, two kinds of friction must be considered: laminar friction, due to air flowing in a smooth, lamina-like boundary layer near the wing surface, and turbulent friction, associated with an eddying, more or less chaotic boundary-layer flow. Most wing boundary layers start out laminar and change to turbulent at some point aft of the leading edge; the location of this point is important, since a turbulent layer exerts considerably higher drag than a laminar one. Since location of the transition point was unknown, however, the best we could do theoretically for the total drag was to add to the curve of pressure drag in figure 9 a uniform friction drag under the assumptions of completely laminar and completely turbulent boundary layers. The positions of the experimental measurements relative to the two resulting curves suggested that the proportion of laminar to turbulent flow on the two wings might be considerably different.
This seemed as far as we could go until I happened, while browsing in the laboratory library, upon a report by W. E. Gray of the British Royal Aircraft Establishment describing a new “liquid-film” method he was using for experimental location of transition at subsonic speeds.15 In applying this method to our situation (after considerable developmental effort), a model was sprayed with a flat black lacquer and coated, just before installation in the tunnel, with a liquid mixture containing mainly glycerin. Since evaporation takes place much faster in a turbulent than a laminar region, it was then a simple matter to run the tunnel (sometimes as much as 20 minutes) until the liquid had disappeared where the boundary layer was turbulent but remained where it was laminar. By dusting the model with talcum powder, which adhered to the moist but not the dry area, the regions of laminar and turbulent flow could then be made visible.
Results for the two triangular wings appear in figure 10. With the maximum thickness at 50-percent chord, turbulent flow (the dark area) takes up only about half of the area aft of the ridge line; for the 20-percent chord location, turbulent flow occupies almost all of the considerably larger area to the rear of the ridge. As a general thing, laminar boundary layers tend to exist in regions in which the surface pressure decreases in the direction of flow, turbulent layers in regions in which it increases. Examination of the theoretically calculated pressure distributions for the two wings showed excellent correlation in both cases between these latter regions of “adverse pressure gradient” and the experimentally indicated regions of turbulent flow. Both the experimental and the detailed theoretical results thus implied a relatively larger viscous drag with the maximum thickness at 20-percent. Support – body interference prevented a decisive comparison between the experimental values of total drag and theoretical values calculated on the basis of the observed areas of laminar and turbulent flow. There could be little doubt, however, why forward displacement of the maximum thickness failed to produce the reduction predicted by inviscid theory.
Following appearance of our third report, NACA headquarters in Washington instructed that I prepare a summary for a joint conference of the American Institute
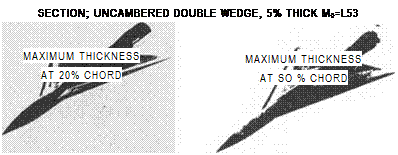 |
Fig 10. Results of liquid-film tests on triangular wings at zero lift (minimum drag).
of the Aeronautical Sciences and the British Royal Aeronautical Society, to be held in New York City in May, 194916. My paper (from which figures 2 through 10 here are taken) was one of two from the NACA, the other being by Floyd Thompson of the Langley Laboratory dealing with rocket and falling-body tests at transonic speeds. That headquarters saw fit to declassify some of our results for this purpose suggests an eagerness, for whatever reason, to point to NACA’s competence in the increasingly important field of supersonic (as well as transonic) research. Our full reports became declassified in 1953.
In the end, our research did not provide an immediate tool for design – nor did we expect it to at this early stage in a complicated and unexplored area of engineering knowledge. Comparison of linear theory with experiment did give confidence in the theory’s potential as a quantitative design tool for certain properties of certain classes of wings. For other properties or other wings, differences between experiment and the findings from the linear inviscid approximation could be estimated or otherwise reconciled. In still other instances, the results posed more questions than they answered. In general, a great deal more would need to be done to achieve anything that could be included under the heading, mentioned in the introduction, of “theoretical design methods” – that is, reasonably general methods of quantitative use to the aircraft designer. The outcome overall was what one might expect at this stage in a new and unexplored area of complex engineering knowledge.


