Flight Test
From its very inception in 1915, NACA understood it “was crucially important… to relate data taken from the testing of models in a wind tunnel to data taken from frillsized aircraft in flight.”39 NACA stressed on-board flight instrumentation, taking
careful measurements from calibrated instruments. Early instrumentation included altimeter, tachometer, airspeed indicator, and inclinometer*
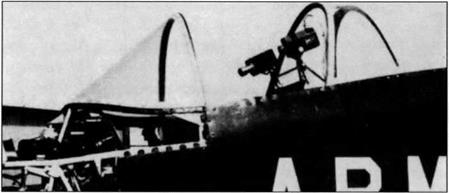
Use of on-board automatic recording devices began very early. In 1919 both an automatic recording accelerometer and a hargraph recorder were used, and in 1920 a Jenny was equipped with 110 pressure orifices connected to glass-tube manometers with data collected by a camera system.40 Photographing duplicate instruments in the rear cockpit led to more elaborate photopanels – which were
 |
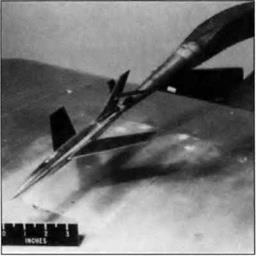
Figure 23. An early version model of the X-2 undergoes tests at the speed of sound in the Langley high speed tunnel (left). To minimize turbulence effects the model is on a rear mount that inserts a strain gauge balance (right) into the model interior that reads out the six fundamental performance dimensions. [Right: NACA as reproduced in Baals and Corliss 1981, p. 38; left: Pope and Goin 1965, Fig. 7:12, p.261.1
|
|
standard during the 1940s and 1950s. Test pilot readouts from instruments sometimes were voice-recorded. As early as March, 1944, on-board flight recorders were used in testing a Martin B26-B-21 Marauder41 and Brown strip recorders42 were carried in the 1944-45 tests of the XP-63 Kingcobra. The Bell XS – 1 used oscillographs to record data for its first Air Force flight at Muroc, August 6, 1947, and also had radar tracking and six channel telemetry to transmit airspeed, control surface position, altitude, and acceleration to the ground station.43 Magnetic tape recording began in the late 1940s. In 1953 a complete recording facility was installed at Edwards AFB, and by the early 1960s magnetic recording on-board or at the end of a telemetry link was becoming standard.44
The 1943 NACA P-39 Aircobra tail-failure tests had “instruments to record variables in the indicated airspeed, pressure altitude, normal acceleration, engine manifold pressure, engine rpm, approximate angle of attack of the thrust line and landing-gear position. Other parameters recorded were aileron, elevator, and rudder position, aileron and elevator forces, rolling, yawing, and pitching velocities, and the pressure distribution over extensive areas of the wings and tail surfaces.”45 By 1959 instrumentation for the X-15 had grown to around 750 channels of data, including telemetered biomedical instrumentation of the test pilot, Scott Crossfield, who thought they’d gone overboard and refused to fly wearing “the damned rectal probe” they wanted.46 The total jumped to over 1200 channels for the 1965-1966 flight tests of the XB-70B.
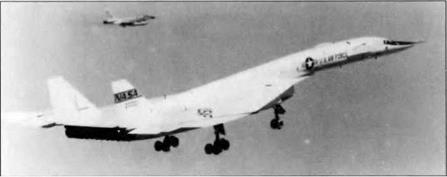
The instrumentation, recording, data reduction, and analysis of airframe data from photopanels and oscillographs is essentially the same as was discussed for engine flight tests, and will not be repeated. Instead, I will focus on the XB-70 which was the first airframe to rely on airborne digital tape recording as primary means for collecting data. Two prototype XB-70s were developed and flown for a total of 129 test flights. One was destroyed in a collision with an F-104 chase plane.
|
Figure 24. A Bell and Howell gun camera mounted above the DOAK 16 rear cockpit records readings by photographing a duplicate instrument panel shown right. This technique is a forerunner of photopanels. [Briining 1963, p. 95.] |
Ц is rumored that development cost $2 billion and that each test flight cost
$800,000 47
The XB-70 had sensors for airspeed, altitude, mach number, acceleration, attitude, attitude rate, temperature, pressure, position, force, stress, quantity, RPM, current, voltage, frequency and events. Sensors were installed throughout the aircraft in close proximity to the physical or electrical stimulation. Two sorts of signals arc collected in flight test: dynamic and quasistatic.4* They vary in frequency and require different recording techniques. For high frequency oscillatory phenomena and flutter, frequency modulated (FM) tape recording is preferred 44 The XB-70 used a 14 track magnetic recorder with conventional EM techniques to
 |
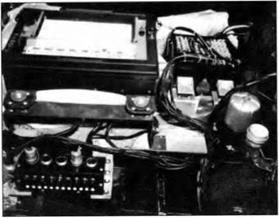
Figure 26. On-board Brown strip recorder used in the XP-63A Kingcobra flight tests. [Young Collection)
|
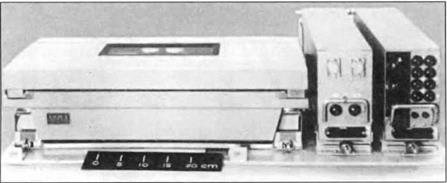
Figure 27. Airborne digital tape unit (13) used in flight lest ol the DC-8 aircraft, ca. 1%2. Also shown are power supply (12) and test demodulators (II). [Bosman el al, 1963, p. 22.) |
record high frequency (> 20 cps) data and the 36 channels of aircraft performance and condition data that were telemetered to the ground for assessing in-flight performance.50
Most XB-70 data were low frequency and recorded using multiplexed pulse – coded modulation recording. The XB-70A collected 706 and the XB-70B 920 channels of low frequency data, Each data sensor was run through conditioning circuitry, then sampled using a solid-stale subcommutator switch. Sampled output then was filtered before being again sampled on one of 50 master commutator channels. Master commutator output was then put through an analog-lo-digital converter and recorded on a 16 track magnetic tape in pure binary form. Two tape recorders connected sequentially allowed recording of 92 minutes of data. Data were sampled at the rate of 20,000 per second.
|
Figure 28. North American XB-70 A mach 3 experimental bomber powered by six General Electric J-93 turbine engines having 30,000 lbs thrust each. It measured 189’ long and 30’ high, with a 105’ wingspan – roughly 2/3 of a football field. [ NASA 68-H-191.] |
|
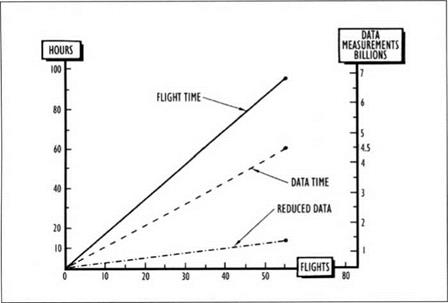
Figure 29. Chart summarizing the data acquisition and reduction during the first 92 hours of XB-70 flight time. [Ince 1967, Fig. 3, p. 199] |
There were two recording modes: In automatic mode a 5 second burst of data was recorded in 30 second intervals. In manual mode, the test-pilot would turn continuous recording on and off. These methods of “editing” the recording cut data collected down to 85 million measurements per flight from the potential 1.3 billion.
The data reduction facility had tape units for reading airborne tapes and an online computer with an external auxiliary computer that could output data to other tape units compatible with NASA data analysis computers. There was a high speed plotter. Data reduction averaged 2.5 days per flight, with 10 million data points handled per day. Quick-look editing records that compressed data by 75% helped determine data-reduction requirements. Computerized data analysis processed an average of 25 million measurements per flight. Plotting was done with cathode-ray displays.
The XB-70B’s 1200 channels of data with 85 million measurements per flight is a far cry from the 2-3 instruments a test pilot could occasionally read and record on a knee pad. Primary motivation for automating data collection and analysis was reduction of data processing time, not improved accuracy – which remained largely unchanged throughout this period. Ideally one wants results of one test run before commencing the next one. Hand transcribing readings from photopanels or oscillographs and analysis by hand-plotting and mechanical calculators retarded the flight test efficiency. Meanwhile whole crews were kept waiting, which was very expensive.
|
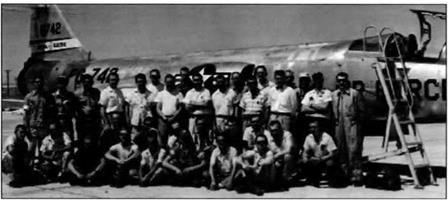
Figure 30. Flight test is personnel intensive. First-flight picture of the complete crew assigned to the GE F-104 742, 1958. Approximately half worked on instrumentation or data analysis. The pilot, Elliot See, later became an astronaut and died in a T-38 crash. Bill Barnes, son of aviation pioneer Pancho Barnes, is front-row right. The author, who built the modular instrumentation package described in the text, is fourth from the right in the second row. [Suppe collection.] |


