AIRFRAME TESTING
Airframe performance ultimately is a function of forces, moments, and pressures produced as the aircraft moves through the air. The six most fundamental dimensions are lift, drag, side force, and moments around the three axes of rotation – pitch, roll, and yaw.26 These contribute to, but do not fully determine performance, handling qualities, stability, and control including stall and spin behavior. In development of an aircraft design, modifications may be made to improve these characteristics, reduce drag, improve structural loadings, or modify systems operations.27 One function of flight test is to reveal prototype design limitations or flaws so that they can be corrected prior to production.
Wind tunnels give essential information about the six fundamental performance dimensions. Their ability to reveal handling characteristics are limited to what can be learned by flying tethered powered models in the tunnel.28 Flight test is required to put the airframe through its full paces and reveal design problems and weaknesses.
Flight testing typically begins with taxi tests, followed by lift-offs to no more than half the wingspan before settling down to assess handling characteristics at crucial take-off and landing transitions where the plane is held aloft by ground effect while below stall speed. Finally take-off is attempted, leading to a succession of flights performing the panoply of test protocols.29
a. Wind Tunnels
There are three main types of wind tunnels: Low speed or subsonic, transonic, and supersonic. The latter two types essentially are modifications of basic low-speed tunnel design and techniques. Although NACA Langley inaugurated a full-sized wind tunnel in 1929,30 wind tunnels typically insert scale models of aircraft into a fast-moving streams of air and take measurements of the six fundamental dimensions and of pressures at various airframe surface locations.
Wind tunnel tests are valuable because (i) “there is absolutely no difference traceable to having the [airframe] model still and the air moving instead of vice versa”31 and (ii) the data collected can be converted into “nondimensional coefficients that have meaning with regard to the full-scale aircraft” despite the fact that the actual “forces and moments measured on a scaled model in a wind tunnel will be considerably different from those of an aircraft in flight.”32 When the equations governing a model can be put in dimensionless form – as can the Navier Stokes equation governing wind tunnels – the observations are scale invariant and can be applied to different-scaled phenomena.33
|
Figure 13. The Glenn L. Martin Wind Tunnel (GLMWT) facility at the University of Maryland, College Park, was a state-of-the – art facility in 1949. Aircraft developed there include the Lockheed Cl30 Hercules and Jet Star, MacDonnell F101 Voodoo, Vaught F-8 Crusader, and the basic dual rotor design for the Boeing helicopters. Today Ford Motor Company wind tunnel testing is done there. Upper diagram shows the basic facility with workshops, wind source, and the beam balance mechanisms. Test area and control center are located on the upper story. The lower figure shows the basic single return tunnel design. Note the vanes that deflect the air around corners, the narrowing of the test section or “jet” preceded by a settling chamber and entrance cone and followed by a breather and then a diffuser region. [GLMWT] |
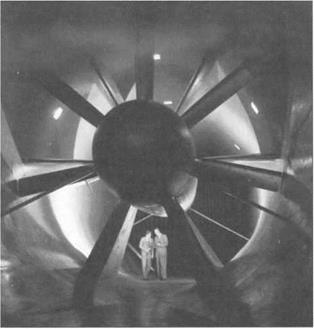 Figure 14: GLMWT wind source, a B-29 propeller connected to a 4,300 volt electric motor, achieves wind speeds of up to 235 mph (200 knots). Below, a scale model is attached to a pylon connected to a balance platform. In the foreground is an array of manometer tubes used to measure pressures at various points on the model’s airfoil surface. [GLMWT]
|
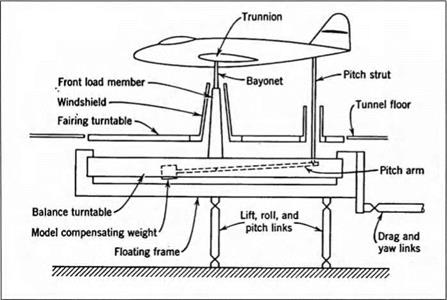
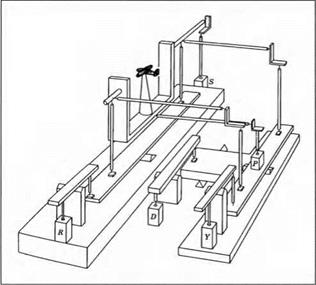 The balances are labeled as follows: Roll; Drag; Yaw moment; Pitch moment; Side Force. Rolling moment, being a Function of differential lift on the two wings, is calculated From the lift. [Rae and Pope 1984, Figures 4.2, 4.3.]
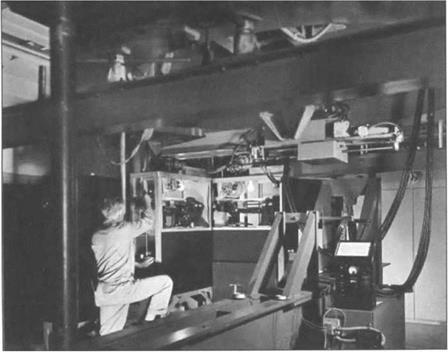
Giant propellers accelerate air movement directed at instrumented test models. In typical subsonic configurations, the model is attached to pylons connected to a balance turntable. Mechanical linkages connect turntable movements to separate beam balances that record each of the six fundamental performance dimensions. Each beam balance is similar to those found at a doctor’s office, although automated. In the original 1949 Glenn L. Martin Wind Tunnel (GLMWT) configuration, the weight was on a threaded screw, and a set of contacts off the wing end of the balance send signals causing the weight to move towards a limit cycle about the balance point. A Selsen servo transmitter connected to the screw counted revolutions. Its output was sent to a Selsen receiver driving a rotary switch giving digital readouts to six significant digits. If loads exceeded what the traveling weight could balance, a cam device automatically added weights to the end of the beam and adjusted the Selsen output. Digital outputs were fed to control panel displays and IBM card punch and gang printer. Measurement accuracy was one part in 100,000. Today the Selsen units have been replaced by links from the beam balances to digital readout laboratory scales. Accuracy is unchanged.
|
Figure 16. 1949 view of GLMWT beam balance mechanism beneath the test chamber turntable seen at top. One of six beam balances mechanisms is shown at the right middle. The light-colored rectangular object is the balance weight mounted on a rotating screw. [GLMWT] |
|
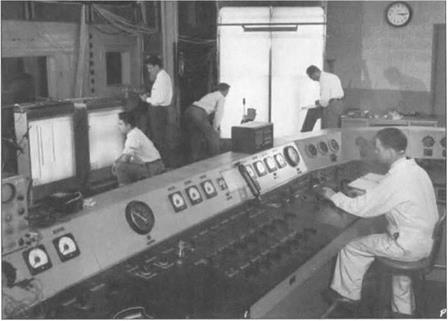
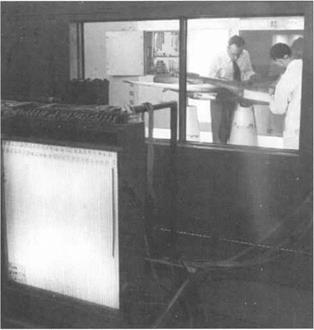
Figure 17. Data gathering during a GLMWT run, ca. 1949. Operator regulates the wind speed from the control console. Two sets of backlit 200 tube manometers are connected to hoses coming from orifices in the model surface. A bundle of hoses leading to the taller set of manometers (right) can be seen directly above the standing man with clip board. Camera placed in front of the right manometer set records readings. [GLMWT] |
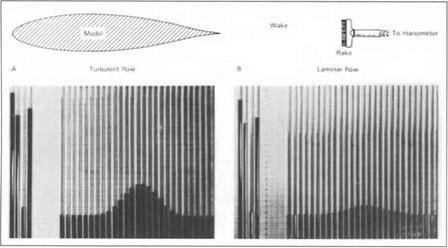
Pressure measurements are made at various places along wing and fuselage. 200 tube manometers connected by hoses to openings on the model’s surface were used at GLMWT. Suitably configured, the adjacent manometer tubes created performance “curves” that could be photographed for more detailed analysis. By the 1960s strain-gauge pressure transducers replaced the manometers. They were so expensive that one was connected to a 48 channel scanivalve. Oscillographs were experimented with, but were not very usable except for dynamic load displacement experiments because they have too high a frequency response and most of what was recorded was noise. Wind tunnel measurements are average values, and readings need to be passed through low-pass filters to eliminate noise. To filter oscillograph data required excessive data processing. Similar problems were experienced when digital tape recorders were tried. The most efficient and reliable way to obtain average values was for tunnel technicians to eyeball meter or digital outputs and record the average value. Only about 8 readings per second are required.
Data processing in 1949 consisted in draftsmen plotting data off digital read-out displays during runs and a bevy of ten women “computers.” Early attempts were made to use IBM card tabulating equipment for data processing, but proved inferior
|
Figure 18. Pressure hoses suitably connected to a bank at’ manometers produce graphic data displays that were photographed—here measurements taken from a wake-survey rake located att of the model. On the left there is zero lift and the hump is proportional to airfoil drag* On the right the airflowr is laminar, producing lift, and drag is reduced. [NACA Langley; as reproduced Baals and Corliss I98L p. 4L} |
|
Figure 19. A model has been coated with oil applied in strips prior to turning on the wind. Observation of oil flow migration patterns reveals specific surface flow patterns. [GLMWT] |
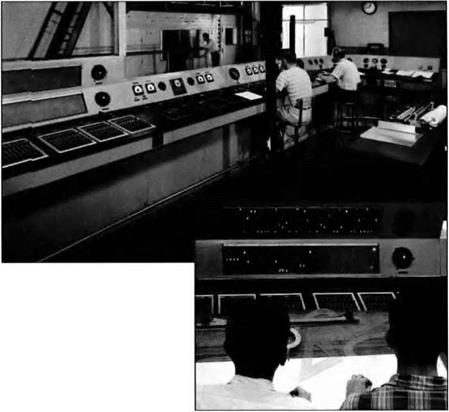
Figure 20. Two means оГdigital data read-out of the six fundamental measurements plus wind speed, ca 1949: An IBM gang primer (right) and digital readout (left) where six rows of ten lighted numbers would give digital readouts of each of the seven measurements. Since average values were desired, one could lock – in a value for recording by use oflhc banks of push buttons below the displays. An IBM card punch (not shown) records data on IBM cards for computer processing. Detail on the left shows two draftsmen hand plotting from the digital read-out in mid-run. [GLMWTJ
 to what women could do. Around 1962 IBM introduced a Mid-Atlantic regional computing center in Washington, D. C., having one IBM 650 rotating-drum computer. The GLMWT began nightly transfers of boxes of IBM cards there for processing. Most universities acquired their first computing facilities around 1961 through purchase of the IBM 1620. When the University of Maryland installed its first UNI VAC mainframe, the original 1620 was moved to the GLMWT where it served as a dedicated machine for processing tunnel data until replaced by an IBM 1800. In 1976 a HP 10000 was installed for direct, real-time data processing. Today it is augmented by five Silicon Graphics Indigo workstations with Reality Graphics.
None of these advances increased precision or accuracy of tunnel measurements. The primary benefit was greater data-processing efficiency. Ideally one wants realtime data analysis so that one can alter test protocols as things proceed. On-line
computing capabilities provided the same testing economies that telemetry provides in flight test environments. Computer processing also improved control of systematic errors in the data gathering process. For example, the six fundamental measurements are supposed to be independent of each other. But the mechanical linkages often transferred influence from another of the components onto a given beam balance. Various Rube Goldbergs involving screw mechanisms driven by motors to counteract such effects were attempted, but never were that satisfactory. Measurement of and data correction for such contaminating influences proved far more reliable.34
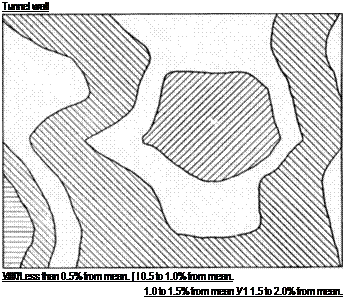 |
Unlike normal flying conditions, the wind tunnel test chamber is enclosed and “the longitudinal static pressure gradient usually present in the test section as well as the open or closed jet boundaries in most cases produce extraneous forces that must be subtracted.”35 These lateral boundary effects corrupt virtually every measurement. Corrections are made for “additional effects due to the customary
Figure 21. Wind tunnel test section calibrations typically reveal asymmetric dynamic pressure distributions with variations above acceptable limits. Even more troublesome are problems of excessive angular variation. These are minimized by adjustment of guide vanes, screens, and propeller pitch. Remaining affects are subtracted from the data using calibration curves. [Pope 1947, p. 83.]
|
Table 1. (Adapted from Pope 1947, pp. 212-213.)
|
failings of actual wind tunnels – angularity, velocity variations, and turbulence” which are known from calibration of the tunnel itself.36
Wind tunnels such as GLMWT cannot achieve transonic or supersonic wind speeds. Early means for achieving such speeds included attaching scale models to very fast subsonic planes and diving them or dropping instrumented bodies for free – fall from very high altitudes.37 Eventually transonic (Mach 0.7-1.2), supersonic (Mach 1.2-5), and even hypersonic (Mach > 5) wind tunnels were created by a combination of beefing-up the drive system (using multiple propellers or even multistage turbine compressors) and drastically narrowing down the throat to produce a Venturi effect that briefly achieves the desired wind speeds.
The main differences between high speed and low speed tunnels are placement of the model downstream from the narrowest part of the throat; the need to change nozzle shape since a unique nozzle shape is required for each mach number; much higher magnitude of energy losses induced by tunnel walls, models, apparatus, etc.; the need to keep the air free of water vapor and small particles of foreign matter such as dust that disturb supersonic flows; and the need to mount the model on beam balances in a manner that does not use pylons and the like which cause excessive disruption of airflow near the model. This is accomplished by mounting the model from behind with a strain-gauge balance measuring device inserted in the interior of the model. The strain gauges measure torsional and other deflections of the mount.38


