ENGINE TESTING
Engine evaluation tends to focus on duct and compressor (turbine and nozzle) efficiencies, pressure ratios, turbine fluid dynamic flow resistance, rotational speed, engine air intake amounts. Typically one measures variables such as fuel flows, engine speeds, pressures, stresses, power, thrust, altitude, airspeed – and then calculates these other performance parameters through modeling of the data. The results usually are presented as dimensionless numbers characterizing inlet ducting, compressor air bleeding, exhaust ducting, etc.12
a. Engine Test Cells
There are two main types of engine test cells:
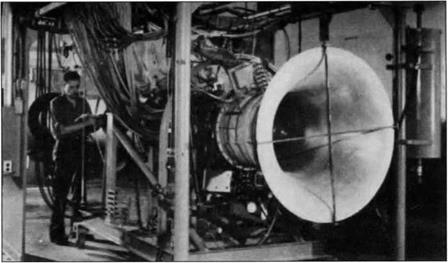
Static cells run heavily instrumented engines fixed to engine platforms under standard sea-level (“static”) conditions;
Altitude chambers run engines in simulated high-altitude situations, supplying “treated [intake] air at the correct temperature and pressure conditions for any selected altitude and forward speed the rest of the engine, including the exhaust or propelling nozzle, is subjected to a pressure corresponding to any selected altitude to at least 70,000 feet.”13
In earlier piston-engine trials an engine and cowling were run in a wind tunnel to test interactive effects between propeller and cowling. Wind tunnels specially adapted to exhaust jet blasts and heat sometimes are used to test jet engines.14
Test cells measure principal variables such as thrust, fuel consumption, rotational speed, and airflow. In addition much effort is directed at solving design problems such as “starting, ignition, acceleration, combustion hot spots, compressor surging, blade vibration, combustion blowout, nacelle cooling, anti-icing.”15
Test cell instrumentation followed flight-test instrumentation techniques, yet was a bit cruder since miniaturization, survival of high-G maneuvers, and lack of space for on-board observers were unimportant. Flight test centers usually had test cells as well, and performed both sorts of tests. Test cell and flight-test data typically were reduced and analyzed by the same people, and similar instrumentation was efficient. Thus test-cell instrumentation tended to imitate, with lag, innovations in flight test instrumentation. Here we only discuss instrumentation peculiar to test cells.
Test cell protocols involve less extreme performance transitions, and thus are more amenable to cruder recording forms such as observers reading gauges. The earliest test cells had a few pressure tubes connected to large mechanical gauges16 and volt-meter displayed thermal measurements. Thrust measurements were critical. Great ingenuity was expended in thrust instrumentation using “bell crank and weigh scales, hydraulic or pneumatic pistons, strain gauges or electric load cells.”17 Engine speed was the critical data-analysis reference variable, yet perhaps easiest to record since turbojets had auxiliary power take-offs that could be directly measured by tachometer.
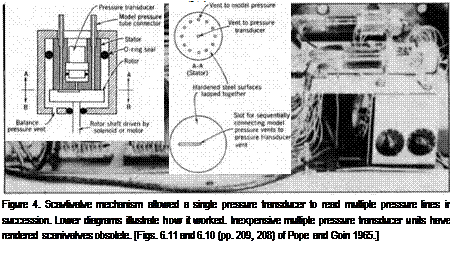
By the late 1940s electrical pressure transducers were used to record pressures automatically. Since they were extremely expensive, single transducers would be connected to a scanivalve mechanism that briefly sampled sequentially the pressures on many different lines, with the values being recorded. The scanivalve in effect was an early electro-mechanical analog-to-digital converter,18 giving average readings for many channels rather than tracking any single channel through its variations. Data processing, however, remained essentially manual until the late 1950s.
|
Figure 3. Heavily-instrumented static engine test cell, 1950s, with many hoses leading off for pressure measurements. [NACA, as reprinted in Lancaster 1959, Plate 2,24b.] |
Test cells operate engines in confined spaces, and engine/test chamber interactive effects often produce erroneous measurements. For example, flexible fuel and pressure lines (which stiffen under pressure) may contaminate thrust measurements. This can be countered by allowing little if any movement of the thrust stand – something possible only under certain thrust measurement procedures. Other potential thrust-measurement errors are:
• air flowing around the engine causing drag on the engine;
• large amounts of cooling air flowing around the engine in a test cell have momentum changes which influence measured thrust;
• if engine and cell-cooling air do not enter the test cell at right angles to the engine axis, an error in measured thrust occurs due to the momentum of entering air along the engine axis;
• pressure difference between fore and aft of the engine may combine with the measured thrust.19
These can be controlled by proper design of the test cell environment or by making corrections in the data analysis stage.
b. Engine Flight Testing
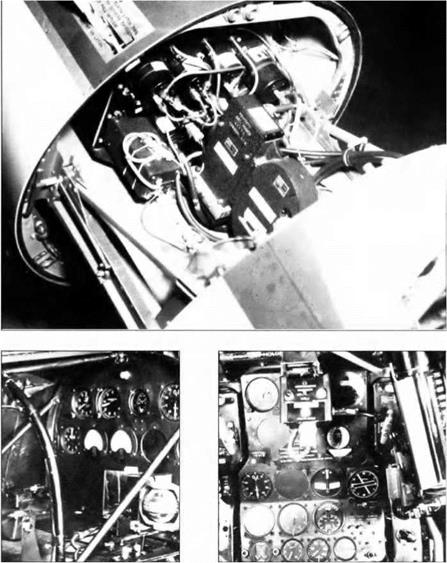
In the 1940s and early 1950s, photopanels were the primary means for automatic collection of engine flight-test data. Early photopanels were mere duplicates of the
 |
test-pilot’s own panel. Later the panels became quite involved, having many gauges not on the pilot’s panel. Large panels had 75 or more instruments photographed sequentially by a 35 mm camera.
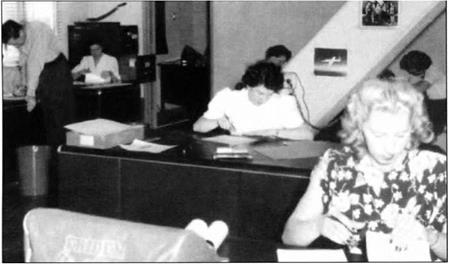
After the flight film would be processed. Then using microfilm readers data technicians would read off instrument values into records such as punched cards. Data reduction was done by other technicians using mechanical calculators such as a Friden or Monroe. On average, one multiplication per minute could be maintained.20 This and the need to hand record each measurement from each photopanel gauge placed severe limitations on the amount of data that could be processed and analyzed. Time lag from flight test to analyzed data often was weeks.
The development of electrical transducers such as strain gauges, capacitance or strain-gauge pressure transducers, and thermocouples enabled more efficient continuous recording of data. They could be hooked to galvanometers that turned tiny mirrors reflecting beams of light focused as points on moving photosensitive
|
Figure 5. Photopanel instrumentation for XP-63A Kingcobra flight tests at Muroc Airbase, 1944-45. Upper photo shows the photopanel camera assembly. Its lens faces the back of the instrument photopanel shooting through a hole towards a mirror reflecting instrument readings. The lower left picture is the photopanel proper, consisting of several pressure gauges, two meters, and a liquid ball compass. The camera shoots through the square hole below the center of the main cluster. The lower right picture shows the test pilot’s own instrument panel. [Young Collection.] |
|
Figure 6. Human computer operation at NASA Dryden Center, 1949, shown with a mechanical calculator in the foreground. [NASA E49-54.] |
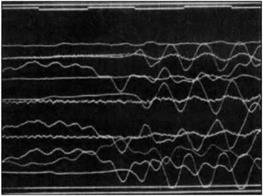
paper, giving continuous analog strip recordings of traces. Mirrors attached to 12-24 miniaturized pressure manometer diaphragms also were used.21 Such oscillograph techniques for recording wave phenomena go back to the 19th century,22 but by the 1950s had evolved into miniaturized 50-channel recording oscillographs (see Figure 10). By 1958, GE Flight Test routinely would carry one or two 50-channel CEC recording oscillographs in its test airplanes.
With 50 channels of data, one had to carefully design the range of each trace and its zero-point to ensure that traces could be differentiated and accurate readings could be obtained. Fifty channels of data recorded as continuous signals on a 12” wide strip posed a serious challenge. A major task for the instrumentation engineer was working out efficient and unambiguous use of the 50 channel capacity. Instrumentation adjusted the range and zero-point of each galvanometer to conform to the instrumentation engineer’s plan.
Another aspect of the instrumentation engineer’s job was to design an instrumentation package allowing for efficient adjustment of galvanometer swing and zero point. This amounted to the design of specific Wheatstone Bridge circuits to control each galvanometer. The 1958 instrumentation of the GE F-104 #6742, designed by George Runner, had a family of individual control modules hand-wired on circuit boards with wire-wound potentiometers to adjust swing. (Zero point was adjusted mechanically on the galvanometer itself.) Each unit was inserted in an aluminum “U” channel machined in the GE machine shop, with plug units in the rear and switches and potentiometer adjustments in the front end of the “U”. These interchangeable modules could be plugged into bays for 50 such units, allowing for
![ENGINE TESTING Подпись: Figure 8. GE data reduction and processing equipment, 1960. Three instrument clusters are shown. In the middle is a digitizing table for converting analogue oscillograph traces to digital data. A push of a button sends out digital values for the trace which are typed on a modified IBM typewriter to the left. The right cluster is a IBM card-reader/punch attached to a teletype unit mounted on the wall for transmitting data to and from the GE Evandale, Ohio, IBM 7090. On the left another IBM card reader is attached to an X-Y plotter. Various performance characteristics could then be plotted. [Suppe collection.]](/img/1243/image031.gif) |
Figure 7. Typical Oscillograph trace record; only 16 traces are shown compared to the 50 channel version often used in flight test. [Source: Bethwaite l%3. p. 232; background and traces have been inverted.)
speedy and efficient remodeling of the instrumentation. A basic fact of flight test is that each flight involves changes in instrumentation, and 742’s instrumentation was impressively flexible for the time. 100 channels of data could be regulated; two recording oscillographs were used.
Oscillograph traces are, of course, analog. By the latter 1950s data analysis was being done by digital computer. This meant that oscillograph traces had to be digitized. Initially it was done by hand. Later special digitizing tables let operators place cross-hairs over a trace and push a button sending digital coordinates to some output device. At GE Flight Test initially a modified IBM Executive typewriter would print out four digits then tab to the next position. Later output was to IBM cards.23 Typewriter output only allowed hand-plotting data, whereas IBM cards allowed input into tabulation and computer processing.
GE Flight Test-Edwards did not have its own computer facilities in the late 1950s and early 1960s. Some data reduction used computers leased from NASA/Dryden, which only ran one shift at the time. Sixteen hours a day, GE leased the NASA computer resources – initially an IBM 650 rotating drum machine, later replaced by an IBM 704 and then by an IBM 709 in 1962. Most data reduction was done, however, on the GE IBM 7090 in Evandale, Ohio. Sixteen hours a day, IBM cards were fed into a card-reader and teletyped to Evandale where they were duplicated and then fed into a data reduction program on the 7090; the output cards then were teletyped back to GE-Edwards for analysis and plotting. Much plotting was done by an automated plotter placing about 8 ink-dots per IBM card.
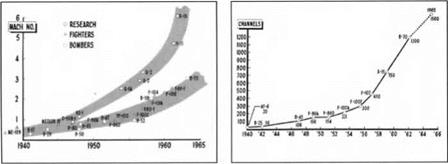
Electronic collection of data with computerized data reduction and analysis radically increased the amount of data that could be collected, processed, and interpreted. Numbers of measurements taken increased at the rate of growing computing power – doubling about every 18 months. The very same computerized data collection and processing capabilities were incorporated into sophisticated control systems for advanced aircraft such as the X-15 rocket research vehicle, the XB-70 mach 3 bomber, and the later Blackbird fighters. As aircraft and engine
|
Figure 9. As aircraft got faster they relied increasingly on computerized control systems. Left – hand chart shows the increase in maximum speed between 1940-1965. The right-hand diagram shows the increase in flight-test data channels for the same aircraft over the same period. [Source: Fig. 1, p. 241, and Fig. 4, p. 243, of Mellinger 1963.] |
|
Figure 10. EDP unit installed at GE Flight Test, Edwards AFB, 1960. The rear wall contains two 2" digital tape units, amplifiers, and other rack-mounted components. A card-punching output unit is off the right. The horseshoe contains various modifiers, the left side for filtering analog data signals and the right for analog-to-digital conversion, scaling, and the like. At the ends of the horseshoe are a 51 channel oscillograph (left) and pen-plotter (right) for displaying samples of EDP processing outputs for analysis. [Suppe collection.] |
control systems themselves became more computerized and dependent on evermore sensors, engine flight test likewise had to sophisticate and collect more channels of data. Fifty channels was the upper limit of what could reliably be distinguished in 12” oscillograph film, and analyzing data from two oscillograph rolls per flight stretched the limits of manual data processing.
The only hope was digital data collection and processing. When data are recorded digitally, many inputs can be multiplexed onto the same channel. Multiplexing is a digital analog to use of a scanivalve that avoids problems of overlapping and ambiguous oscillograph traces by digital separation of individual variables. A further advantage of digital processing is that the data are in forms suitable for direct computer processing, thereby eliminating the human coding step in the digitization process.
GE got the contract to develop the J-93 engine for the B-70 mach 3 bomber. Instrumentation on this plane was unprecedented, exceeding its North American predecessor, the X-15. GE geared up for the XB-70 project, building a new mammoth test cell for the J-93 in 1959-60 with unusually extensive instrumentation (e. g, 50-100 pressure lines alone), introducing pulse-coded-modulation digital airborne tape data recording, developing telemetering capabilities, and contracting for a half-million dollar Electronic Data Processing (EDP) unit.
The EDP unit primarily was a “modifier” in the instrumentation scheme, filtering signals through analog plug-in filters, doing analog-to-digital conversions, and performing simple scalings. Data recorded on one 2” digital tape could be converted into another format (2” tape or punched card) suitable for direct use on the IBM 704,
|
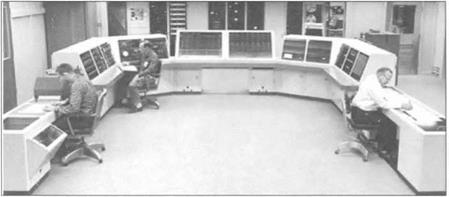
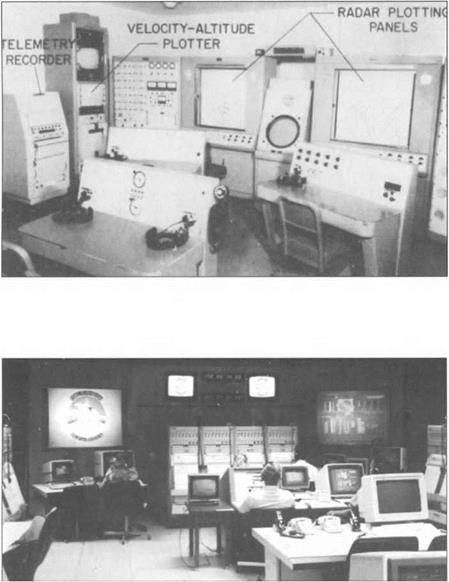
Figure 11. Upper picture is the X-l 5 telemetry ground station ca. 1959. The bulk of the station is devoted to radar ground tracking of the X-l5. Only the recorder, plotter and bank with meters in the left portion are concerned with flight-test instrumentation. Lower picture is the Edwards AFB Flight Test Center telemetry ground station in the early 1990s. Computerized terminals and projected displays provide more extensive graphical analysis of performance data in real time. [Upper photo: Sanderson 1965, Fig. 19, p. 285; lower photo: Edwards AFB Flight Test Center.] |
709, and 7090. It also had limited output transducers that produced strip or oscillograph images for preliminary analysis. The surprising thing about this huge EDP unit is that it had no computer – not if we make having non-tape “core” memory the minimal criterion for being a computer. The decision was to build this device for data reduction, then “ship” the data via teletype to GE-Evandale for detailed processing and analysis.
In telemetry signals collected by transducers are radioed to the ground, as well as sent to on-board recorders, where a ground station converts them to real-time displays – originally dials, meters, and X-Y pen plotters, but today computerized displays, sometimes projected on large screens in flight-test “command centers.” Test flights are very expensive, so project engineers monitor telemetered data and may opt to modify test protocols mid-flight.24 Telemetry provides the only data when a test aircraft crashes, destroying critical on-board data records. GE Flight Test developed telemetering capabilities in preparation for the XB-70 project, trying them out in initial X-15 flights.
The X-15 instrumentation was a trial run for the XB-70 project (both were built by North American), although the X-15 relied primarily on oscillographs for recording its 750 channels of data.25 With the XB-70 project, the transition from hand-recorded and analyzed data to automated data collection, reduction, and analysis is completed. The XB-70B instrumentation had about 1200 channels of data recorded on airborne digital tape units. Data reduction and processing were automated. Telemetry allowed project engineers to view performance data in real time and modify their test protocols. Subsequent developments would sophisticate, miniaturize, and enhance such flight-test procedures while accommodating increasing numbers of channels of data but do not significantly change the basic approach to flight test instrumentation and data analysis.
A supersonic test-bed was needed for flight test of the XB-70’s J-93 engines. Since the J-93 was roughly 6’ in diameter – larger than any prior jet engine – no
|
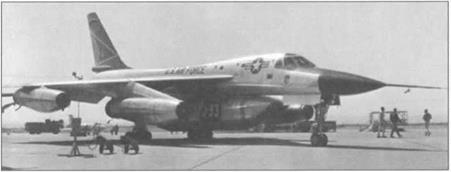
Figure 12.7 Modified supersonic B-58 for flight testing the J-93 engine that would power the XB-70 Mach 3 supersonic bomber. A J-93 engine pod has been added to the underbelly of the airframe. [Suppe collection.] |
established airframe could use the engine without modification. GE acquired a B-58 supersonic bomber which it modified by placing a J-93 engine pod slung under the belly. Once the aircraft was airborne the J-93 test engine would take over and be evaluated under a range of performance scenarios.


