The Experiment of Fage and Simmons
A significant part of the experimental evidence for the circulation theory came from Arthur Fage (1890-1977). Fage was a retiring man who had trained as an engineer at the Royal Dockyard School in Portsmouth. His father had been a coppersmith in the dockyards. Fage won a scholarship to the Royal College of Science in London and then moved to the National Physical Laboratory in October 1912 as a junior assistant in the aeronautics section. In 1915 he published The Aeroplane: A Concise Scientific Study.29 The book was “written to meet the requirements of engineers” (v). It embodied a wholly empirical approach and made no mention of either the discontinuity theory or the circulation theory. With his “infinite capacity for taking pains,” Fage “became progressively a better and better research scientist” and acquired the reputation of being one of the NPL’s most meticulous experimenters.30
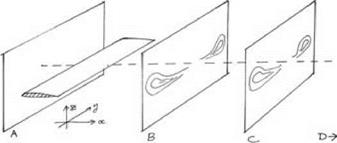
After Bryant and Williams’ work on the infinite wing, the next step in the Research Committee’s plan was to test Prandtl’s account of the flow around a finite wing. This work was undertaken by Fage and L. F. G. Simmons.31 They tested a rectangular model wing with a 3-foot span and a chord of 0.5 foot that was set at an angle of incidence of 6° to a wind of 50 feet per second. The wing had a cross section known as the RAF 6a. This particular wing was chosen because it had been studied in earlier experiments at the NPL, and the lift coefficient and the distribution of lift along the span were already known. Fage and Simmons used a speed-and-direction meter to probe the space round the wing to build up a detailed, quantitative picture of the flow. They measured the flow as it cut a number of transverse planes across the wind channel at various distances behind the wing (see fig. 9.5). If the x-axis is taken as the longitudinal axis of the channel, then positions on these transverse planes would be defined in terms of y – and z-coordinates where the y-axis lay parallel to the span of the wing and the z-axis indicated positions above and below the level of the wing. These coordinate axes are shown in the figure. Notice that the origin is located at one of the wingtips. The transverse planes chosen for study were called A, B, C, and D. Distances were expressed in terms of the chord of the wing. Plane A, which featured very little in the subsequent discussion, lay at a distance of about half a chord in front of the wing. Planes B, C, and D, the main interest of the experimenters, lay respectively at distances of x = 0.57, x = 2.0, and x = 13.0 chords behind the wing. The aim was to measure the properties of the trailing vortices as they cut through planes B, C, and D. On the basis of previous work (such as Piercy’s), Fage and Simmons were by now confident of the existence of the vortices but their question was: Did these vortices behave quantitatively in the way that Prandtl had assumed?
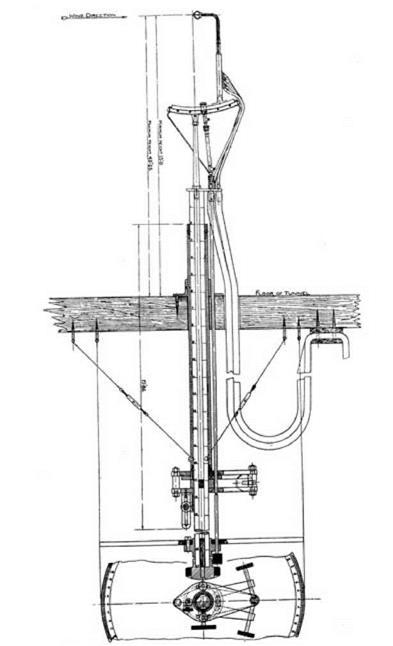
For convenience the test wing was actually mounted vertically and the speed-and-direction meter was inserted through a hole in the floor of the wind channel. The meter could be moved up and down, parallel to the leading and trailing edges. The tips of the wing were fastened to transverse runners on the roof and floor of the wind channel so that the wing could be made to slide from one side of the channel to the other without altering its angle of incidence. These two degrees of freedom (the wing going from side to side and the meter going up and down) allowed measurement to be made within
|
figure 9.5. A schematic representation of Fage and Simmons’ experiment to test Prandtl’s theory of the finite wing. The flow was determined by detailed measurement in three planes, B, C, and D behind a wing (plane D, which is at a large distance behind the wing, is not shown in the diagram). |
a given, transverse plane. After taking measurements in plane A, they had to remount the wing at a different distance from the meter to measure the flow in plane B, and similarly for planes C and D. The measurements were made with an instrument of a standard type developed at the NPL (see fig. 9.6). It consisted of four open-ended manometer tubes forming a head that could be tilted on its mounting as well as turned from side to side. The orientation of the head of the meter could be manipulated from outside the wind channel. When the head was directly aligned with the local flow, the pressure in the four tubes was equal, which allowed the direction of the air at that point to be read off. The speed of the air was given by the difference in pressure between one of the four tubes and a fifth open-ended tube pointing in the direction of the free flow.32
Fage and Simmons took hundreds of measurements in order to build up a quantitative picture of the flow, and they were able to draw a number of important conclusions. First, they found that the velocity components (u) in the direction of the main flow (that is, parallel to the x-axis) were very little changed by the air having passed over the wing. The circulation theory implies that the speed immediately above and below the wing was modified, but measurement showed that soon after its passage over the wing the u-component settled down to a steady value that only varied by about 1 percent. This (approximately) constant velocity could therefore be ignored when considering the flow in the transverse planes. Exploiting this fact, Fage and Simmons argued that the flow within each plane could be considered as a two-dimensional flow. This two-dimensional flow was taking place in the (y, z) plane, so the two components of speed in the flow were v (along the y-axis) and w (along the z-axis). Fage and Simmons proceeded to compute the stream functions, streamlines, and vorticity of this flow at a large
|
|
figure 9.6. Apparatus used by Fage and Simmons for detecting the speed and direction of the flow behind a wing. As shown, the neck of the apparatus is inserted through the floor of the wind tunnel. The head of the apparatus can be raised or lowered, turned from side to side, and also rotated. From Fage and Simmons 1926, 306. (By permission of the Royal Society of London) number of points in each transverse plane by using the values taken from their measurements.
By the term “vorticity” Fage and Simmons meant (dw / dy—dv / dz). This is the quantity previously introduced and defined (in chap. 2) as the measure of the rotation of a fluid element. The two terms “rotation” and “vorticity” were used interchangeably. Each of the two parts of the expression represents a rate of change and hence the slope of a graph. Thus the value of dw/dy at a given point refers to the rate of change of the speed w with distance along the y-axis at that point. A corresponding definition applies to dv/dz. Fage and Simmons had a sufficient number of velocity readings of v and w at a sufficient number of points to find the relevant slopes and rates of change. They were thus in a position to compute the rotation or vorticity at each of these points. Once numerical values of this expression were established for a large number of points on the planes B, C, and D, it was possible for the experimenters to draw curves linking up the points of equal vorticity. The result was a striking picture of the flow.
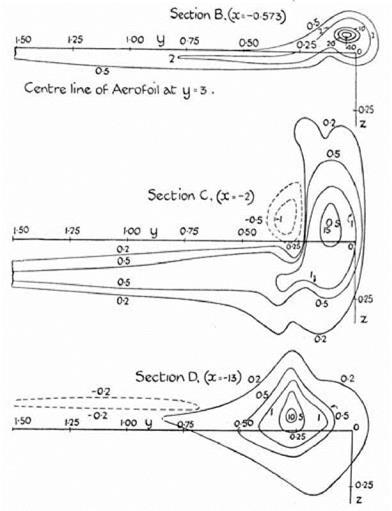
Fage and Simmons’ figures show the contours of equal vorticity in each of the transverse planes behind one-half of the wing (see fig. 9.7). The wing is not shown on these diagrams but lies horizontally, obscured, as it were, by the vorticity. The wingtip would be on the right, and the center of the wing, which is off the diagram, would be on the left. The top figure refers to plane B immediately behind the wing; the other two refer to planes C and D, which are set farther back. Examination of the figures shows that initially (at about half a chord behind the wing) vorticity is spread in a narrow sheet along the trailing edge but becomes more concentrated near the tip. At a distance of two chords behind the wing, the vorticity at the tip has becomes less intense and more spread out. These changes, said Fage and Simmons, demonstrate the unstable character of the vortex sheet and show that it rolls up in the way predicted by Prandtl. The third picture shows the rolling up to be almost complete. The vorticity is now confined to the area near the wingtip. Citing Lamb’s Hydrodynamics, Fage and Simmons state that the diagrams show that, in accordance with the classical mechanics of vortex motion, the vortices behave as if they are attracted to one another. Their centers are progressively displaced toward the center and away from the tips.
Fage and Simmons then used their data to test the quantitative aspects of the theory and to construct detailed connections between their observations and the mathematics of Prandtl’s picture. The central questions were whether the flow (outside the trailing vortices) was irrotational and whether the lift and circulation around the wing were connected to the trailing vorticity
|
figure 9.7. Lines of equal vorticity at three distances and across three planes, section B, section C, and section D, behind a finite wing. The wing is not shown but its centerline is off the diagram on the left and the wingtip is close to the origin O, which in this figure is positioned on the right. From Fage and Simmons 1926, 132. (By permission of the Royal Society of London) |
according to the laws identified by Prandtl. To address the question of irrota – tional flow, Fage and Simmons computed the circulation around a sequence of rectangular contours of increasing size drawn on their transverse planes. They chose rectangular contours, with sides parallel to the y – and z-axes, because they already had the relevant velocity components needed for the calculation. The circulation they sought was given by the quantity (vdy + wdz) calculated around the contour. The chosen rectangles all enclosed the same areas of vorticity in the wake of the wing. According to Stokes’ theorem the circulation around these contours gave a measure of the vortex strength they enclosed. The calculated values for the circulation were close to one another, and this, argued Fage and Simmons, showed that outside the vortex wake the flow was irrotational—that is, as the contours got bigger, no further rotating fluid elements, and hence no further vorticity, can have been enveloped by the contour.
This argument for the irrotational character of the flow outside the vortex wake had exactly the same form as Glauert’s inference when he gave his preliminary analysis of Bryant and Williams’ results. A number of contours of increasing size display the same amount of circulation, ergo the contours pass through an irrotational flow. This was the inference to which Taylor had taken exception. Had Fage and Simmons fallen into the same trap as Bryant and Williams? The answer is no. As a deductive inference the argument put forward by Fage and Simmons is not compelling (for the reasons that Taylor gave), but as an inductive inference the conclusion is plausible. Given their other computations dealing with vorticity in the flow, and the contours showing its distribution, these results reinforced the conclusion that the flow outside the wake was, indeed, irrotational.
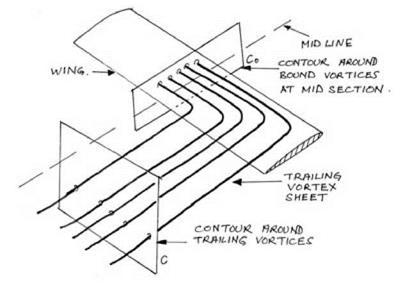
The most important quantitative question was whether the strength of the vortices trailing from the three-dimensional wing had been correctly predicted by the proponents of the circulation theory. Fage and Simmons deduced that, according to Lanchester and Prandtl, the strength of vorticity leaving the semi-span of the wing should equal the circulation around the median section of the wing. If these two quantities could be found and compared, then the prediction could be tested. Fage and Simmons developed this argument mathematically, but the intuitive basis of the deduction can be seen immediately by inspecting figure 9.8.
The figure shows a version of the refined horseshoe vortex. The vortices that run along the span of the wing all pass through a contour around the median section of the wing. The value of the circulation around this contour is determined by the vortices that run through it (from Stokes’ theorem). All of these vortices then peel off the trailing edge of the wing. Their total strength can be assessed by the circulation around another contour, namely, any contour that captures and includes them. For example it can be measured by the circulation around the rectangular contours drawn in the planes B, C, and D that have been previously discussed. Fage and Simmons compared these empirically based values with the predicted circulation around the median section.
How did Fage and Simmons evaluate the predicted circulation? It is the
|
figure 9.8. Circulation around contour C0 at the midsection of the wing is created by the bound vortices running along the span of the wing. According to Prandtl the combined effect of this circulation should equal the circulation around contour C created by the vortices which trail behind the half span of the wing. |
quantity that has previously been called Г0. Recall that in chapter 7, it was shown that by making the assumption that the lift distribution was elliptical, Prandtl had given an expression that predicted the value of Г0 from known properties of the wing and the flow. Prandtl had shown that
2VSC.
г = L,
0 bn
where CL is the coefficient of lift, S is the area of the wing, b is the span, and V is the free-stream velocity. All of these were known quantities for the wing used in Fage and Simmons’ experiment. In this way they were able to compare the predicted value of Г0 and the observed results for the circulation around the vorticity coming away from the trailing edge. The two values should be the same. The theoretical prediction was corroborated for the flow up to two chord lengths behind the wing, that is, for planes B and C. On plane D, at a distance of thirteen chord lengths, the agreement was not so good. The measured vorticity was around 18 percent too small. Some of the vortic – ity appeared to have dissipated, but, within the limits of experimental error, Fage and Simmons declared that the match between theory and observation was a good one.
 |
———– СглЬтти1 Ur*S of Y
 |
——- – Фспіоиґ Uno of Ф
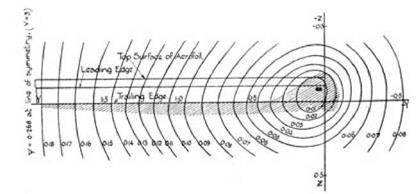
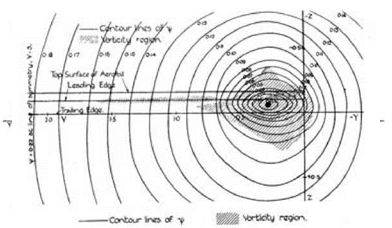
figure 9.9. The streamlines of a trailing vortex at three distances behind the tip of a finite wing. The position of the wing is shown on the diagrams with the wingtip on the right, behind the center of the vortex. The centerline of the wing is on the left. From Fage and Simmons 1926, 320-22. (By permission of the Royal Society of London)
Fage and Simmons not only drew the lines of equal vorticity (shown in fig. 9.7) but also drew the actual streamlines of the vortices that issued from the wings and passed through the planes B, C, and D. This, too, was an exercise that involved considerable computation. First they had to check that the preconditions for the existence of a stream function, y, were fulfilled. Was the continuity equation satisfied? Laboriously, they concluded that it was. They then identified the values of the stream function at a large number of points in the (y, z) plane in order to draw the streamlines y = constant. On grounds of symmetry they took the line y = 3, the center line of the wing, as the streamline y0. The pictures they produced from their measurements and computations were convincing. “The diagrams,” they said, “illustrate clearly the changes in the character of the airflow behind the aerofoil: close to the aerofoil, the contour lines are ovals with the ends pointed inwards; as the distance behind the aerofoil increases, the contour lines become more and more circular—indicating that the vorticity is becoming more concentrated” (320). The results are shown in figure 9.9.
Fage and Simmons had significantly strengthened the case for the circulation theory. They had effectively picked up the argument at the point where Pannel and Campbell had left it in 1916 when curiosity seems to have been swamped by collective incredulity. Unlike the conclusions of Bryant and Williams, the work of Fage and Simmons was not challenged by Taylor.33 Others, such as Lanchester and Foppl, had made qualitative observations of trailing vortices and, more recently, photographs had been taken, but now the vortices had been directly measured and linked to the mathematically defined relations of the circulation theory. Could it now be said that the entities that were subject to empirical measurement in the laboratory had been clearly identified as one and the same with the entities referred to in the circulation theory? If so, the work of Fage and Simmons would represent a qualitative change in the status of the circulation account of lift. What had previously been a theory could now, arguably, be counted as a directly verifiable fact.


