Category Dreams, Technology, and Scientific Discovery

My hurried move back to Iowa City

As mentioned earlier, because of the demands of the new IGY Heavy Payload instru­ment development, and so that I could join in the task of processing and analyzing the Explorer I and III data, Van Allen and I agreed that I should return to the Iowa campus as quickly as possible. Adding to the urgency of my return was the grow­ing possibility that an additional project (beyond the IGY Heavy Payload) might be approved and would also have to be conducted on a crash basis. In fact, that project did quickly materialize, culminating in the launch of Explorer IV and the Explorer V launch attempt, as described in Chapter 13.

Upon reaching Pasadena from my Iowa City stopover, I found that Rosalie had everything under control, and two-week-old George was thriving. The week was completely consumed, on the home front, by preparations for our move back to Iowa City and, at the laboratory, on program planning and detailed design work for the Juno II instrument. Rosalie carried most of the burden of preparing the household for the move, closing all of our bank and utility accounts, terminating our house contract, taking Barbara out of school (again), and packing our personal belongings.

My primary occupation during that week was to design the electrical and mechani­cal configuration of our IGY Heavy Payload instrument and to order its GM counters. I also spent time collaborating with other experimenters and engineers on the new project, including Vernon (Vern) Suomi at the University of Wisconsin, Mr. Hanson, who worked for Gerhardt Groetzinger at the Research Institute for Advanced Studies, and H. Burke at Huntsville.

I also completed the steps necessary to terminate my active employment at JPL. Following their suggestion, I remained an inactive and unpaid member of the JPL staff. That was intended to make it easy for me to return there for postgraduation

Подпись: CHAPTER 12 • DISCOVERY OF THE TRAPPED RADIATION
FIGURE 12.4 The author preparing the spare Explorer I satellite for the move back to Iowa City.

It, along with all University of Iowa laboratory equipment and our personal effects, was loaded into a U-Haul trailer and pulled behind our Mercury for the drive home. The scene is at the rear of our temporary residence on Claremont Street in Pasadena.

employment, if that should be my desire. It gave me a prearranged employment option more than two years before I received my Ph. D. degree. As it developed, I accepted postgraduation employment at the newly forming NASA Goddard Space Flight Center, and the staff arrangement with JPL, for which I was very grateful, was eventually terminated.

My return to Iowa posed an interesting problem. I was going off the JPL payroll, and they had no obligation to pay for my return move. As SUI had had no financial involvement in my original move west in November, and since they were simply resuming my previous employment at Iowa City, they had no legal obligation to help in moving my family and household possessions back. Fortunately, since I was transporting all of our laboratory equipment, parts, supplies, and spare Explorer I and III satellite payloads back to Iowa, Van Allen felt justified in paying for my own direct transportation expenses. He also adjusted my salary for the next few months to help compensate me for flying Rosalie and the three children back.

Rosalie’s return airline flight with Barbara, Sharon, and two-week-old George on Saturday, 5 April, was as uneventful as one might hope under the circumstances, as they were able to take a direct flight from Los Angeles to Cedar Rapids, only 30 miles from Iowa City. My parents picked them up at the airport and delivered them to our Rochester Avenue home.

To keep the expense of the move as low as possible, I rented a U-Haul trailer to transport the laboratory equipment, spare Explorer I and III units (Figure 12.4), and our personal effects. I left Pasadena on Monday, driving our Mercury sedan and the rented trailer via a southern route through Arizona, Texas, the Oklahoma Panhandle, and the new Kansas turnpike to avoid the possibility of lingering harsh winter weather

OPENING SPACE RESEARCH

Подпись:in the high Rockies farther north. I arrived in Iowa City on Friday, 11 April, after a very pleasant solo drive. My journal reported of the trip, “No bad weather, beautiful scenery.”

As I drove into Iowa City, events at the cosmic ray laboratory were unfolding at a feverish pace. The IGY was in full swing. Van Allen and our small cluster of students, faculty, and staff were hard at work on an energetic balloon, rocket, rockoon, and satellite IGY research program.

There was great public and scientific excitement about the burgeoning space pro­gram, especially after the national humiliation of losing the distinction of being first in space to the Soviets. Pressures were mounting for capitalizing on the early U. S. successes as quickly as possible with follow-on space programs.

That Saturday, 12 April, Van Allen, McIlwain, and Ray brought me up to date on the current situation. The satellite instruments on both Explorers I and III had been working flawlessly and were providing a growing tide of data. Explorer I had reached the end of its operating life, and its ground station recordings were being converted on a routine basis to strip chart records and columns of numbers. Explorer III was working well, a reasonable rate of successful interrogations was being achieved, and the first data recordings were reaching us. The account of that Saturday meeting, as recorded in my personal journal several days after the fact, contains the following paragraph:

By now a very startling and interesting result has appeared in the data. We have encountered some extremely high counting rates at the higher altitudes, and at perhaps all latitudes within north and south 33 degrees. Present thinking is that they may be due to electron clouds. Counting rates are probably over 4000 per second. This result appears on both Explorers, and there seems to be no doubt as to its existence.33

We decided at that meeting to change our Juno II heavy payload counter configuration to allow us to study the new phenomenon with greater discrimination.

During late March and early April, Van Allen, with active involvement by Carl McIlwain, continued discussions with Wolfgang Panofsky that had begun at the 11­12 March meeting at JPL. A satellite was being considered that would have detectors arranged to make more quantitative measurements, both of the natural radiation that we were observing and of charged particles that might be injected into trapped trajectories by a high-altitude nuclear burst—what came to be known as Project Argus.

A few days before our 12 April get-together, Van Allen conveyed our growing belief in the existence of the high-intensity radiation regions to Panofsky. That was the first revelation of the new discovery to anyone outside our small group of four.

CHAPTER 12 • DISCOVERY OF THE TRAPPED RADIATION 339

That letter and its background and implications are discussed further in the next chapter.

Van Allen was sufficiently confident in our conclusions by mid-April that he discussed them with several IGY program officials, namely, Richard Porter, Hugh Odishaw, Homer Newell, and William Pickering.34 Those calls were made, most likely, on Monday, 14 April.

The U. S. National Committee had recently established a policy for the release of scientific information derived from U. S. satellites in the IGY program.35 It provided that all satellite-derived data should be conveyed to the U. S. National Committee in advance of any public release. Odishaw reminded Van Allen of that policy and admonished him to make no public announcement of the new discovery until a formal IGY release could be arranged. The two agreed, during that conversation, on a release date of 1 May.

Second-generation spacecraft

During the last two years of the 1950s, the space program advanced rapidly, both in terms of the technology and of the science. The growing experience and confidence of the Soviet and American technicians and scientists, combined with the increasing

CHAPTER 14 • EXTENDING THE TOEHOLD IN SPACE


Sputnik III


1. MAGNETOMETER


10, DEVICE FOR MEASURING

THE INTENSITY OF PRIMARY C05MI RADIATION


5. MAGNETIC AND IONIZATION

MANOMETERS

6. ION CATCHERS

7. ELECTROSTATIC FLUXMETER *. MASS SPECTROMETRIC TUBE

9. DEVICE FOR THE REGISTRATION OF HEAVY NUCLEI IN COSMIC RAYS


Second-generation spacecraft

2. PHOTO-MULTIPLIERS FOR THE

Подпись: 11. PICK-UPS FOR THE REGIS TRATION OF MICROMETERS REGISTRATION OF THE CORPUSCULAR RADIATION OF THE SUN

3. SOLAR BATTERIES

4. DEVICE FOR THE REGISTRATION OF PHOTONS IN COSMIC RAYS

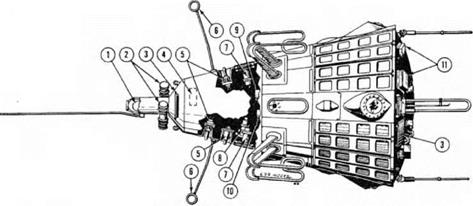
FIGURE 14.5 Sputnik 3, with identification of its major features. Weighing nearly 3000 pounds and measuring nearly 12 feet long and 6 feet in diameter, it was gigantic in comparison with early U. S. satellites. (Courtesy of the National Aeronautics and Space Administration.)

weight-carrying capability of U. S. launch vehicles, led quite naturally to spacecraft of increasing size, capability, and complexity.

Some of the spacecraft of that period are referred to as second-generation space­craft, distinguished by the inclusion of multiple primary instruments that made in­creasingly discriminating measurements. In many cases, instruments were comple­mentary in nature, carefully chosen to address specific questions.

Sputnik3 Sputnik 3, discussed earlier in Chapter 12, with its immense weight and array of scientific instruments, was the first of the second-generation spacecraft. A full-blown automatic scientific laboratory, the Soviets originally planned that it would be carried on their first satellite launch attempt. Problems with payload development and the resulting launch postponements led to the preparation and earlier flight of the simpler Sputniks 1 and 2.

This spacecraft was indeed remarkable. Launched on 15 May 1958, it carried, in a single carrier, more instruments than had been planned for the entire U. S. Vanguard program. Illustrated in Figure 14.5, the spacecraft was designed to investigate the pressure and composition of the upper layers of the atmosphere, the concentration of positive ions, the magnitudes of the electric charge of the Sputnik and of the Earth’s electrostatic field, the magnitude and direction of the Earth’s magnetic field,

OPENING SPACE RESEARCH

Подпись:the intensity of the Sun’s corpuscular radiation, the composition and variation of primary cosmic radiation, the distribution of the photons and heavy nuclei in cosmic rays, and micrometeors.

Sputnik 3 provided a wealth of new information. Reaching higher latitudes than the earliest U. S. Explorers, it traveled through the lower north cusp of the outer radiation belt. It helped put to rest scientists’ early fears that micrometeorites might be dense enough to seriously impede our ventures into space. Important results related to the geomagnetic field, low-energy ions, and electrons in the far atmosphere and near space and related to cosmic rays were obtained from this mission.10

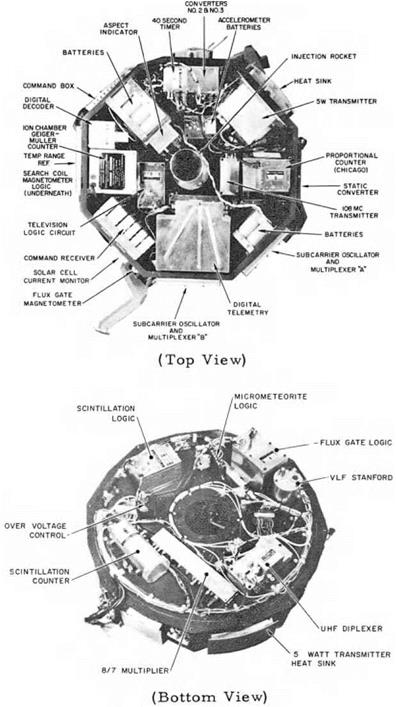
Explorer 6 Explorer 6 was the second highly successful second-generation space­craft, and the first one by the United States. It was a spheroidal satellite with four solar paddles designed to study a wide range of geophysical and astrophysical phenomena. The arrangement of components within the central cylindrical platform is shown in Figure 14.6.

Whereas the Explorer I, III, and IV and Sputnik 1 and 2 orbits all lay within 1800 miles of the Earth’s surface, and therefore barely edged into the high-intensity radiation belts, the highly eccentric Explorer 6 orbit was another matter. It laced through the entire region of high-intensity radiation from 152 to 26,350 miles and from north 47 degrees to south 47 degrees, making 113 passes through the outer belt during its operating lifetime.

The spacecraft was another product of STL. They had already built and launched Pioneer 0 (Thor-Able 1), Pioneer 1, and Pioneer 2—Explorer 6 was an evolutionary extension of that work. All those early STL missions were initiated by the Air Force’s Ballistic Missile Division, when the three armed services were still vying for major roles in space, i. e., before NASA was formed in October 1958 to head the civilian space program.

Explorer 6 represented a major advance in the development of U. S. spacecraft technology and scientific research. Launched on 7 August 1959 by a Thor-Able-3 ve­hicle from Cape Canaveral, it weighed 141 pounds. One of its major objectives was to develop and test technologies that would be needed for deeper space flight, including journeys of millions of miles into interplanetary space. Long-term electrical power generation and data transmission over great distances were major challenges that guided some of the design considerations. Solar power generation coupled with stor­age batteries provided the electrical power. An onboard receiver facilitated Doppler tracking, fired the injection rocket, changed the rate of data transmission, turned on a simplified television system, and performed other functions. Three data transmit­ters were used—one operated intermittently with a five watt output for tracking and digital data transmission. It was designed so that it would be able to drive a 150 watt amplifier on future deep space missions. Two other transmitters radiated continuously

Second-generation spacecraft

FIGURE 14.6 Top and bottom views of the main instrument shelf in Explorer 6. A quasi­hemispheric dome covered the top of this short cylinder, with a truncated dome on the bottom. Extending outside the cylindrical center section shown here were four paddles containing an array of solar cells to serve as the primary power source—the satellite was often referred to as the pad­dle wheel satellite. The cylindrical structure shown here measured 29 inches in diameter, and the overall satellite height was 26 inches. (Courtesy of the U. S. Air Force.)

OPENING SPACE RESEARCH

Подпись:at 100 milliwatts for analog data transmission. Since similar data were conveyed by the digital and analog systems, the older and more proven analog system was used primarily to monitor the performance of the new “Telebit” digital system that fed the higher-power transmitter.

The ambitious scientific program rivaled that of the Soviet Sputnik 3 program, in spite of Explorer 6’s smaller size and lighter weight, through its use of low-power miniature transistor electronics throughout. With this and the first Pioneer mission, the Air Force (and NASA, once it was formed) provided an opportunity for a new group of experimenters beyond those of us associated with the earlier Vanguard and Juno programs. A team under Robert (Bob) A. Helliwell, L. H. Rorden, and R. F. Mlodnosky at Stanford University provided a Very Low Frequency Receiver and studied the whistler phenomenon and radio propagation through the ionosphere. Carl D. Graves of STL studied electron density above the ionosphere by radio propagation measurements from the UHF and VHF transmitters.

Manring and Dubin at the Air Force Cambridge Research Center continued their earlier work by providing an impact microphone-type micrometeorite detector. Fluxgate and spin-coil magnetometers were developed, and their data were analyzed by an STL team that included Charles P. Sonett, Edward J. Smith, Paul J. Coleman Jr., J. W. Dungey, D. J. Judge, and A. R. Sims. They provided new information on the overall structure of the geomagnetic field and of its temporal variations.

A pair of instruments consisting of an ionization chamber and GM counter was provided by a team at the University of Minnesota headed by John R. Winkler and including Roger L. Arnoldy and Robert A. Hoffman. That group produced a set of rather complete contours of constant counting rate and radiation dosages. Interestingly, the contours displayed a shape quite different from those that we had deduced at Iowa at an earlier time. Their work helped to stimulate a period of energetic research during the next few years to better understand the trapping mechanism, injection and decay processes, and effects of solar variability.

A group at the University of Chicago provided a wide-angle, triple-coincidence, semiproportional particle telescope to investigate the solar modulation of cosmic radiation and the origin and structure of the Van Allen belts. That group was headed by John A. Simpson and included Charles Yun Fan and Peter Meyer at Chicago and Wilmot N. Hess and J. Killeen at the Lawrence Radiation Laboratory in California.

A scintillation counter was prepared by a team at STL consisting of Tom Farley, Al Rosen, and N. L. Sanders to examine the energy spectra of electrons and pro­tons. STL also provided an image-scanning television system. It obtained very low resolution pictures of the Earth that were a precursor to later cloud cover-observing instruments.

CHAPTER 14 • EXTENDING THE TOEHOLD IN SPACE 411

An array of instruments was provided by STL to measure satellite orientation and various engineering parameters. Finally, a group of scientists used the orbit data for studies of lunar and solar perturbations, atmospheric drag, and effects due to ellipticity of the Earth’s equator. Those individuals included Yoshihide Kozai and Charles A. Whitney from the Smithsonian’s Astrophysical Observatory; Kenneth Moe from STL; and A. Bailie, Peter Musen, E. K. L. Upton from the Naval Research Laboratory.

Explorer 7 As mentioned in Chapter 10, serious planning for a second-generation U. S. satellite began as early as March 1958, buoyed by the elation over the successful Explorer I launch. It envisioned retaining the Juno I upper-stage arrangement but substituting the larger Jupiter Rocket for the Redstone first-stage booster, thereby substantially increasing the weight-lifting capability.

Initial planning by the Huntsville and Pasadena engineers and Washington officials proceeded at a rapid pace, and an experiment complement was soon identified. The Huntsville and Pasadena crews initially referred to that satellite as the International Geophysical Year (IGY) Heavy Payload, although the name Payload 8 (PL-8) was sometimes used. It was to include a package for continuation of our original Univer­sity of Iowa cosmic ray research objective, and that objective was quickly upgraded to follow up on the radiation belt discovery. The other experiments included a Solar X-ray and Lyman-Alpha Photometry Experiment under Herbert Friedman’s leadership at the Naval Research Laboratory (NRL), a Radiation and Heat Balance Experiment by the University of Wisconsin group consisting primarily of Verner Suomi and Robert Parent, and a Heavy Cosmic Ray Experiment using an ionization chamber developed at the Glenn L. Martin Company’s Research Institute for Advanced Stud­ies in Baltimore, Maryland, under the leadership of Gerhardt Groetzinger. Several engineering experiments were also included.

Primary support for the IGY Heavy Payload during the pre-NASA era was provided by the U. S. National Academy of Sciences, which renamed the embryonic satellite Payload 16 (PL-16). Presumably, that was because it was the sixteenth U. S. mission (both successful and unsuccessful) that carried the IGY banner. NASA, upon its formation, took over responsibility for the project and renamed it Satellite 1 (S-1), or the first in the series of NASA managed satellites. Its final name after launch became Explorer 7.

The original plan was to launch this satellite (seen in Figure 14.7) in mid-1958. Our initial schedule at Iowa called for delivery of a first flight cosmic ray instrument to Huntsville on 1 May. The initial schedule began to slip as the more urgent work on Explorers IV and V began to dominate the attention of everyone at Huntsville, Pasadena, and Iowa City. Further delays occurred as the Huntsville and Pasadena teams shifted to preparation for the Pioneer 3 and 4 shots.

Second-generation spacecraft
A first attempt to launch S-1 did not occur until 16 July 1959. At liftoff, the power supply for the guidance system failed, and the vehicle was destroyed by the range safety officer 5.5 seconds later. Of course, by that time, the vehicle was barely off the ground, and the destruct command spilled the entire load of fuel and oxygen onto the launch pad. An enormous fire resulted, and those of us in the blockhouse remained sealed there for over an hour as the firefighting crew fought to bring it under control. The blockhouse blast door was ultimately opened, and we emerged to see the wreckage of the vehicle and our payload strewn around the area. I recovered the charred and melted remains of my cosmic ray instrument and a few other bits and pieces, which I retained until turning them over to the Smithsonian’s Air and Space Museum several years ago. Ernst Stuhlinger and I also examined a four foot rattlesnake that had been cooked by the conflagration.

Nearly three months elapsed before a second launch could be attempted. That happened on 13 October 1959, with a picture perfect launch of Explorer 7. The new

CHAPTER 14 • EXTENDING THE TOEHOLD IN SPACE 413

satellite was placed in an orbit that ranged from 356 to 667 miles in height, high enough that the satellite is still orbiting the Earth 50 years later. Its orbital inclination was about 50 degrees, carrying the satellite far enough north and south to provide valuable new information about the Earth’s trapped radiation.

Suomi and Parent’s heat balance instrument worked perfectly. It initiated the era of satellite studies of the Earth’s climate. Using both satellite observations of the Earth’s heat balance and atmospheric cooling rates measured by net flux radiosondes, Suomi was able to establish the important role played by clouds in absorbing radiated solar energy. Those observations established that Earth’s energy budget varies markedly due to the effect of clouds, the surface albedo, and other absorbing constituents. Using these instruments, Suomi and his team discovered that the Earth absorbed more of the Sun’s energy than originally thought and demonstrated that it was possible to measure and quantify seasonal changes in the global heat budget.

By the time of the Explorer 7 launch, Gerhardt Groetzinger, originator of the Heavy Cosmic Ray Experiment, had died. Martin A. Pomerantz, of the Bartol Research Laboratory, took over the experiment and published results in several papers.11

The twin-GM counter cosmic ray instrument was developed by the author, with major assistance by Bill Whelpley. Graduate student John W. Freeman calibrated the counters. The experiment’s purposes were to provide a “comprehensive spatial and temporal monitoring of total cosmic ray intensity, the geomagnetically trapped corpus­cular radiation, and solar protons.” It operated for more than 17 months, broadcasting its data on two frequencies: 108.00 MHz and 19.994 MHz. That second transmitter was set to the low frequency, with a relatively high output power level of 0.6 watt, in order to make it easy for widespread participation in data recovery by radio amateurs and other interested persons.

The particle measurements from our instrument were somewhat anticlimactic. By the time the satellite had finally been launched, Explorer IV, also with a high orbital inclination, had already provided key information on the structure of the lower fringes of the radiation belts. More discriminating instruments for mapping the radiation belts, identifying the causative particles, and learning of their energy spectra had been operated on Sputnik 3 and Explorer 6. Furthermore, the wide-ranging orbit of Explorer 6 and deep space trajectories of Pioneers 3 and 4 had extended the observations much farther into space. Nevertheless, the Explorer 7 counters provided good observations of short – and long-term temporal variations over a relatively long period, from launch on 13 October 1959 to early March 1961.

Brian O’Brian joined our group as an assistant professor in August 1959 and became a major player in the Explorer 7 analysis effort.12

Vanguard III Vanguard III, launched on 18 September 1959, used the seventh and last launcher built under Navy aegis for the IGY. Somewhat heavier than

OPENING SPACE RESEARCH

Подпись:the earlier Vanguards due to an improved final-stage rocket, at a bit over 50 pounds, it carried three primary instruments, a magnetometer by Jim Heppner and his group at GSFC to measure the shape and intensity of the Earth’s mag­netic field, an array of micrometeorite and other environmental sensors by Herman E. LaGow and his group at GSFC, and a pair of ionization chambers by Herb Friedman and his group at NRL to measure the Sun’s X-ray and ultraviolet emissions.

The thousands of magnetic field measurements obtained during its 84 day period of operation provided a charting of the Earth’s magnetic field with an accuracy far greater than hitherto achieved.13 Furthermore, the magnetometer’s measurements of very low frequency signals known as whistlers yielded estimates of electron densities in the high atmosphere.

The impact rate of interplanetary matter was highly variable. No penetrations of the satellite’s shell were detected, and the impact rate was found to be low enough so as to present only a minor hazard to future spacecraft. Even at that, analysis of readings from the micrometeorite detectors put the accumulative influx of cos­mic dust impinging upon the Earth at an impressive figure of about 10,000 tons a day.

The experience gained in the Vanguard program led to a long series of Explorer and Interplanetary Monitoring Platforms at the new GSFC in Greenbelt, Maryland, that continued until the recent past. Those craft provided opportunities for scientists who had cut their teeth on Vanguard to continue their work and for a fresh wave of emerging scientists to join in the grand adventure.

Pioneer 5 Pioneer 5 was a continuation by the Air Force, NASA, and STL of the work begun with Pioneers 0, 1, and 2. Its primary purposes were to further develop the technology needed for deep space operation and to make scientific measurements in space at a distance well removed from the Earth’s influence. The structure, solar paddle arrangement, and weight (about 95 pounds) were all generally similar to those of the earlier missions, and the scientific instruments were furnished, by and large, by the same group of experimenters. The previously anticipated 150 watt amplifier was added to provide the radiated power needed for long-distance interplanetary communication.

Pioneer 5 was launched on 11 March 1960 into an orbit around the Sun lying between the orbits of Venus and Earth. Its apoapsis (greatest distance from the Sun following its final orbital injection) was 0.993 astronomical unit (AU) and its peri – apsis was 0.706 AU. It requires 311.6 Earth days for each complete circuit around the Sun.

Data were received from the craft at 64, 8, and 1 bits per second, depending on distance from the Earth and the size of the receiving station antennae. Most of the

CHAPTER 14 • EXTENDING THE TOEHOLD IN SPACE 415

telemetered data were recovered by the radio telescope at Jodrell Bank Observatory in England and by a tracking station in Hawaii. Useful data were received from the spacecraft for 50 days until 30 April, after which telemetry noise and weak signal strength made useful reception impossible. During the operational period, the high-power transmitter was commanded on about four times each day for 25 minutes duration each time. A new distance record was set for radio reception in interplanetary space when Jodrell Bank received a faint but readable signal from over 22 million miles away.

The mission provided the first measurements of the magnetic field in deep inter­planetary space and of its variations. Most notably, it found that the field did not drop to zero at distances well removed from the Earth but that the Sun’s field remained detectable there. It also measured solar flare particles and cosmic radiation in the interplanetary region.

S-46 It must be noted that throughout the rest of the 1950s, both the Soviets and Americans continued to have a substantial number of disappointing launch failures. One of those was the satellite that we built at Iowa as project S-46. The S-46 mission had a special significance for me, as the project served as the subject for my Ph. D. thesis in electrical engineering.14

This was the second spacecraft that was largely university built, following on the heels of the State University of Iowa’s earlier Explorer IV (and failed Explorer V). The scientific objectives were chosen to examine a manageable subset of the many then – prevailing questions about the high-intensity radiation belt structure and composition. For that purpose, the satellite was designed for an orbit with a high eccentricity and inclination.

Specifically, with that satellite, we hoped to achieve the following:

• monitor the intensity structure of the two principal zones of geomagnetically trapped radiation over an extended period to help establish the origins and gross dynamics of the two zones

• study the correlations with solar activity and with various geophysical phenom­ena such as aurorae and magnetic storms

• study the particle composition and energy spectra of the respective components

• make a first exploratory study of the energy flux of very low energy trapped particles by use of zero-wall-thickness detectors

Built with NASA support, with Les Meredith at GSFC serving as the payload supervisor, our Iowa group did the overall mission and spacecraft design and designed and built the scientific instruments. The major working partners were, again, our friends at the Army Ballistic Missile Agency (later NASA’s Marshall Space Flight Center), who built the spacecraft mechanical structure, battery, solar power system,

OPENING SPACE RESEARCH

Подпись: 416FIGURE 14.8 The S-46 satellite payload. The central cylinder was the familiar six inch in diameter instru­ment container, with the detectors in the portion that protrudes from the top of the cubical solar cell array. The black circles on the top plate of the cylinder are some of the openings for the detectors.

and telemetry system. They also handled all aspects of the launch vehicle preparation and launch.

I continue to marvel at the wonderfully pleasant and productive working envi­ronment that existed between our groups. Individuals there with whom I worked closely on this mission, in addition to Ernst Stuhlinger, were Josef Boehm, H. Burke, Charles Chambers, Gerhardt Heller, Hans Kampmeier, Fred Speer, Sam Stevens, Art Thompson, and Hermann Wagner.

Tracking and telemetry reception was to have been done by a network of NASA stations that would have provided about 90 percent recovery from the highly eccentric orbit. My primary interface there was, again, John Mengel at GSFC.

The instruments included a pair of cadmium sulfide solid state detectors, two GM counters in an electron magnetic spectrometer arrangement, and a third GM counter to establish data continuity with the measurements from Explorers I, III, and IV.

CHAPTER 14 • EXTENDING THE TOEHOLD IN SPACE 417

The detectors were designed, prepared, and calibrated by a group of rising students. John Freeman led the CdS detector effort, assisted by Guido Pizzella, James (Jim) D. Thissell, and Carl McIlwain. Curtis (Curt) D. Laughlin took the electron spectrometer assembly, and Lou Frank led the GM counter calibration effort. Wonderfully effective engineering support was provided by students H. Kay McCune, Bill Whelpley, and Donald (Don) C. Enemark.

The mechanical components of the payload were machined in the department instrument shop by Ed Freund, Robert (Bob) Markee, Robert (Bob) Russell, Edward (Ed) McLachlan, and Michael (Mike) McLaughlin, under the general supervision of its leader, J. George Sentinella. Drafting was provided by Ray Trachta, G. G. Lippisch, A. M. Hubbard, and B. W. Fry. Others helping with the project at Iowa included Gene Colter, John Davies, Chuck Horn, Lucille Lin, Wei Ching Lin, Thomas (Tom) Loftus, Bob Wilson, Keith Wilson, and Andrace Zellweger.

The completed satellite payload is shown in Figure 14.8. The launch attempt was made on 23 March 1960, but the assembly consisting of the second-, third-, and fourth-stage rockets did not function properly. Van Allen made a valiant ef­fort to arrange a second attempt, but an additional launch vehicle was simply not available.

Fortunately, comparable instruments and their derivatives were flown successfully on later spacecraft, most notably on Explorer 10 launched on 25 March 1961, Explorer 12 launched on 15 August 1961, Explorer 18 (Interplanetary Monitoring Platform 1) launched on 27 November 1963, and the Eccentric Orbiting Geophysical Observatory 1 launched on 5 September 1964.

Special acknowledgments

My wife, Rosalie (who now prefers the shorter name “Ros”), was an active partner in the events related in this story. I am indebted to her for that enthusiastic participation and for her forbearance and support during the more than ten-year period of preparing this manuscript.

James A. Van Allen, in addition to providing the leadership for much of the program at Iowa, encouraged and helped me in writing this story. Throughout the process of researching and drafting this manuscript, he provided information and commented on portions of the text. Special thanks are due to him for preparing the book’s foreword.

Leslie (Les) H. Meredith, the first graduate student with whom I worked in the Iowa Cosmic Ray Laboratory, introduced me to the art of balloon instrument design and fabrication. He provided substantial previously unpublished technical and anecdotal information about the rockoon expeditions that has been incorporated into this book. He reviewed the full manuscript and provided substantive comments.

Frank B. McDonald, from my first association with him at Iowa in 1953 through our most recent discussions, has been a strong guide, personal booster, close friend, and a major factor in my professional development. He reviewed segments of the manuscript during its preparation and provided important comments on the full draft.

Ros and I developed especially close personal and professional bonds during our university years with Carl E. McIlwain and his wife, Mary; Laurence (Larry) J. Cahill Jr. and wife, Alice; and Ernest (Ernie) C. Ray and Mary. Ernie passed away before I began writing this book, but Mary Ray assisted in relating Ernie’s role. Carl McIlwain and Larry Cahill reviewed portions of the manuscript during its preparation and provided very valuable assistance by reviewing the full text.

Special thanks are extended to Nancy Johnston and Mary McIlwain, who painstak­ingly proofread the full manuscript.

Others, too numerous to list, encouraged me and provided input during the long process of writing this book. Many of them are mentioned in the text. Grateful thanks are expressed to all of them.

Endnote

1 It can be argued that the Space Age started earlier with, for example, the flight of balloons into the high atmosphere in the early Twentieth Century, or the first launch of a V-2 rocket to a height greater than 100 miles in 1946. In this work, I somewhat arbitrarily mark the beginning of the Space Age with the first durable excursion into the region above the Earth s sensible atmosphere, that is, with the launch of Sputnik 1 on 4 October 1957.

Adding rockets to the program

Initial IGY planning envisioned the use of well-established ground-based instruments and instruments carried aloft by balloons. Although rocket-borne instruments were anticipated, they were not initially seen as a major program component. With time, however, the growing potential of sounding rockets for a wider variety of observations was recognized.

As an early step to organize a rocket component within the United States, the Upper Atmosphere Rocket Research Panel (UARRP) established a Special Committee for the IGY with Homer Newell as chairman. As U. S. planning for the IGY progressed, the U. S. National Academy of Sciences, having the official responsibility for overseeing the U. S. IGY program, established a Technical Panel on Rocketry. The UARRP transferred the Special Committee for the IGY to the Technical Panel on Rocketry, and further planning for the rocket program progressed under that umbrella.

The National Academy notified the CSAGI of the U. S. intent to include a sounding rocket program as part of its contribution to the IGY. That led, at the second meeting of the CSAGI at Rome in September and October 1954, to the formation of a Working Group on Rockets under Homer Newell’s chairmanship. With that step, rocket sound­ings became an integral part of the IGY program, and by the time the IGY opened, a formidable program of rocket observations was in place.

Scientists gather to review IGY progress

Official detailed planning for the IGY had been under way for several years, as related earlier. A series of four meetings of the Council of Scientific Unions’ full CSAGI had been held in Brussels (June-July 1953), Rome (September-October 1954), Brussels (September 1955), and Barcelona (September 1956) to provide overall planning for the endeavor. Specialized regional and discipline meetings were set up to plan specific details. One of those discipline meetings was the first CSAGI Conference on Rockets and Satellites, held in Washington, D. C., on 30 September through 5 October 1957. The conference agenda included general reports from all countries having IGY rocket and satellite activities, establishment and meetings of working groups, and the presentation of technical papers. Four working groups were established during the opening plenary session, and those groups worked throughout the conference to prepare specific resolutions for endorsement by the full conference.

OPENING SPACE RESEARCH

Подпись:The official record of the conference is contained in volume 2B of the Annals of the International Geophysical Year.8

I combined participation in that conference with further testing and coordination of our instrument development at the Naval Research Laboratory, as described in the previous chapter. Van Allen and Larry Cahill were on the State University of Iowa (SUI) equatorial and Antarctic shipboard rockoon-launching expedition, so I was the sole conference attendee representing the university. I presented, on behalf of their authors, all four of the SUI papers, one a report of the status of our satellite instrument development by Van Allen and me, two others exclusively authored by Van Allen, and one by Cahill and Van Allen.9

Herbert Friedman, head of the U. S. delegation for the Working Group on Internal Experiments and Instrumentation Program, asked me to participate in the work of his group in Van Allen’s absence. I also participated, for the same reason, in the activities of the Working Group on Rocketry.

Much has been said about the participation and comments by the Soviets at that conference. The Soviet delegation was headed by Anatoly A. Blagonravov. By that time, he had risen to the rank of lieutenant general of artillery. In June 1946, the USSR had set up an Academy of Artillery Sciences, with Blagonravov as head of its Department for Rocketry and Radar. He soon became that academy’s president. In that position, he first seriously considered the development of an Earth satellite in 1948, based partly upon the stimulus of captured German documents that described Eugen Sanger’s antipodal bomber, a piloted, winged rocket that would reach an altitude of 160 miles and skip on the top of the atmosphere halfway around the world.

By the time of the 1957 conference, Blagonravov was a full-fledged member of the Soviet Academy of Sciences and of the Interdepartmental Commission on Interplan­etary Communications. He, along with Leonid Sedov, would act as “front men” for Soviet science at international gatherings for many years to come. A chain smoker, his demeanor was courteous and mild-mannered. In contrast to the two younger men with him in Washington, he appeared very distinguished and professorial, with his shock of white hair. Although his inner intensity showed from time to time, according to Walter Sullivan’s account, “much of the time he wore a thin smile and carried his Russian cigarette tipped upward at a rakish angle.”10

He made the formal USSR report at the opening session on Monday, 30 September. In that report, he spent most of his time outlining plans for 85 to 95 rocket launchings from three sites: (1) Franz-Josef Land, (2) in the Antarctic near Mirny, and (3) between 50 and 60 degrees east longitude. He did include a short statement that satellites would be launched, and, simply, that the onboard experiments would vary. He also attended the Tuesday session of the Working Group on Satellite Internal Experiments and Instrumentation Program and the Thursday afternoon session of the

CHAPTER 6 • SPUTNIK! 165

Working Group on Satellite Vehicles, Launching, Tracking, and Computation. Again, very little information about the Soviet satellite program was forthcoming.

A. M. Kasatkin, the second-ranking Soviet delegate and another highly placed Soviet scientist, attended the meetings of the Working Group on Rocketry. He also attended all four sessions of the Working Group on Satellite Vehicles, Launching, Tracking, and Computation. He provided substantial specific information about the sounding rocket launch sites. The firings from Franz-Josef Land would be conducted from Cheynea Island; those from Antarctica would be conducted from shipboard near the Soviet station Mirny; and the 50 degree to 60 degree east longitude firings would be fired from the Soviet Union from between 50 degrees and 60 degrees north latitude. One action of that working group was to agree on a form to notify all participating countries whenever rockets were to be launched. Kasatkin agreed that they would fully comply with the use of that form with regard to the launching of meteorological rockets, but only information on the instrumentation and containers would be pro­vided for other geophysical rockets. They made no commitment whatsoever about notifications related to satellite launches.

S. M. Poloskov was the third Soviet delegate. He served as vice chairman of both the Tuesday and Wednesday sessions of the Working Group on Satellite Internal Experiments and Instrumentation Program. During those presentations, Poloskov stated that the first USSR satellite would carry 20 and 40 MHz transmitters, and that the question of the frequency to be used in later satellites was open for further consideration. He also stated, in response to a query, that the USSR satellite orbit would probably be highly elliptical so that the height of passage over a given spot would vary markedly. Beyond those two points, he, too, said nothing of specific Soviet satellite plans.

Although there had been some advance work in preparing for the meetings of the working groups, the memberships of those groups were not established until the conference opening, and their agendas were not set until their first meetings. As a result, the focus and activities of the working groups evolved progressively during the conference. The working group resolutions were formed at their meetings, and those resolutions represented one of the primary products of the conference.

The technical sessions, on the other hand, were organized purely for the exchange of technical information about the various national programs. The list of sessions, their chairmen, and the listing of officially submitted technical papers had been announced ahead of time, and preprint copies of those papers were distributed at the opening of the conference.

There had been considerable disappointment before the conference that the Soviets had not offered many technical papers. Only three USSR papers, two on satellite

OPENING SPACE RESEARCH

Подпись:tracking and one on determining the composition and pressure of air at high altitudes from sounding rockets, had been submitted prior to the conference and included on the official program.

However, when the USSR delegates arrived, they introduced 17 additional papers. Copies of all of those papers were hastily made and distributed, but most of the Western attendees were unable to read the Russian texts. Naturally, the attendees were anxious to hear of the Soviet plans, and changes were made in the technical sessions to accommodate the new material. Although those changes do not appear in the IGY Annals’ general coverage of the conference, some of the new information did show up in the individual reports of working group sessions. My sparse notes from the meeting show, for example, that Soviet papers dealing with substantial details of their rocket programs for measuring the structure of the atmosphere and for meteorology were presented and discussed.

As far as their satellite program was concerned, their new papers focused on Earth satellite orbital dynamics, potential experiments, and other generic topics, rather than on specific Soviet plans.

As mentioned, the decision by the Soviets to use the lower 20 and 40 MHz frequen­cies greatly disturbed the American attendees, as the entire internationally coordinated U. S. radio receiving and tracking system had been designed to operate at a frequency of 108 MHz, as agreed at the Barcelona CSAGI meeting a year earlier. That frequency had been chosen to permit more accurate tracking of satellite motion, since the higher frequency signal would have been subject to less distortion as it passed through the atmosphere.1112

In retrospect, one can see that one highly significant hint about the launch escaped us during that week. Most of the Soviet lectures were delivered in Russian, with simultaneous translation into English. Most of the written papers were also in Russian, and those were not translated until well after the conference. During the discussion following the oral presentation of one of the technical papers, a Soviet delegate made a passing comment about the timing for the first satellite launch. The Russian word was translated at the time as soon, which was taken by the listeners to mean soon on the time scale of the IGY. A more accurate translation of the Russian word would have tipped us off that the Soviet launch was imminent, literally, due at any moment. Having missed that subtlety, we did not anticipate that the first launch would occur only a few days later.

A hurried move to California

Early on Friday, 15 November, Rosalie, our two children Barbara and Sharon, and I headed west from Iowa City. The trunk and backseat of our black-and-white 1956 Mercury sedan were bulging with the prototype instrument package, my laboratory notebooks, a myriad of components and tooling for the flight units, meager clothing for the family, and a few kitchen items. Rosalie and I fitted five-year-old Barbara and four-year-old Sharon into “cockpits” formed among our belongings on the backseat. Rosalie, now more than six months pregnant, made herself as comfortable as possible for the more than 1600 mile trip, and we were off.

Interestingly, that was just two days after one of those major decadal life passages, my thirtieth birthday. To celebrate it, I was setting off on another great adventure, full of grand expectations and supreme confidence.

It was a time before modern interstate highways. Our path took us along old U. S. Highway 6 through Iowa, Nebraska, and Colorado into Utah, down central Utah on Highway 89, and along Highway 91 through southern Nevada and California to Pasadena. Passing through Denver on Colfax Avenue, we approached the Rockies. Climbing to the top of the continental divide, we paused just long enough to admire the windswept snow and to take a picture of a shivering Rosalie in front of the sign marking 11,988 foot high Loveland Pass. In Utah, we made a slight detour to drive through Zion National Park. Without pausing to invest in Las Vegas’ chief industry, we descended from Cajon Pass north of San Bernardino in the early Monday afternoon of 18 November. Slightly ahead of schedule, we decided to take what appeared on our map to be a scenic shortcut from Cajon Junction, along Angeles Crest Highway through the San Gabriel Mountains, to La Canada, just outside the JPL gates. That turned out to be a big mistake—we learned to beware of shortcuts! We wound along that tortuous mountain road for hours, finally arriving in La Canada about sundown. It was too late to check in at JPL, so we had a late dinner and settled down in a motel for the night.

OPENING SPACE RESEARCH

Подпись: 232Our California adventure began with a thud in the middle of the night. Sharon fell out of bed! Not surprisingly, she started crying, but no amount of consoling seemed to quiet her. We finally took her in our bed, but her whimpering continued. On a whim, I started feeling her shoulder, where her pain seemed to be centered, and discovered a knot on her collarbone. Realizing that it was probably broken, we did our best during the night to keep her comfortable. Upon rising, our first task was to locate a doctor. After reading the X-rays, he confirmed the broken collarbone diagnosis, took the simple step of binding her shoulder, and we went on our way.

Our next task was to locate a place to stay until we could find rental housing. We finally located a motel that was willing to rent on a day-to-day basis, but at a weekly rate if we stayed as long as one week. It was located on Pasadena’s Colorado Boulevard, about a mile east of the downtown area, and an easy commute to JPL.

I finally entered the JPL gatehouse on early Tuesday afternoon, 19 November. I met immediately with several of the JPL managers and engineers, including Bill Pickering. In addition to being JPL’s director, Bill had also been one of Van Allen’s colleagues from their days of launching instruments on V-2s at White Sands, had a strong interest in the possibilities of research via satellite, and took a strong personal interest in our cosmic ray instrument preparations. We agreed that the most pressing task for me was to turn over all the information and equipment that I had brought from Iowa.

In spite of the press of work at JPL, finding longer-term housing for the family could not be deferred. With help from the JPL housing office, we were lucky to quickly locate a furnished house at 371 Claremont Avenue in north Pasadena. Our landlady, Mrs. Copeland, lived on the upstairs floor. We settled into the main level, with the furniture and kitchen items provided with the house, the few belongings we had brought with us, and the small shipment that was delivered by the moving company soon thereafter.

With my working days and evenings at the laboratory, Rosalie carried most of the burden of setting up housekeeping in Pasadena. After enrolling Barbara in her new kindergarten, she proceeded to organize the house and take care of the family. As mentioned earlier, she was in her third trimester of pregnancy. In spite of growing discomfort, she accomplished miracles and complained very little.

The house worked out well, with the main problem being its lack of adequate heat. Its sole heat source was a gas-fired convection heater in one wall of the main room. That may have been adequate for a normal Pasadena winter, but the 1957-1958 winter was unusually cold. We shivered in sweaters throughout the entire winter, and Rosalie and I worried constantly about the children (especially newly born George during the latter months) as they crawled around on the perpetually cold floor. Nevertheless, we all survived without significant illness.

CHAPTER 8 • GO! JUPITER C, JUNO, AND DEAL I

A hurried move to California

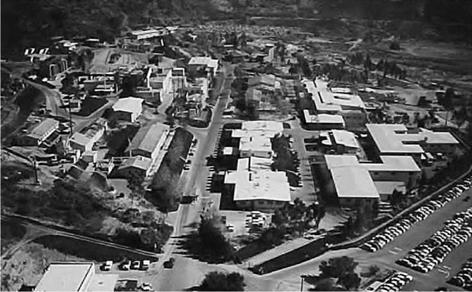
FIGURE 8.3 Aerial view of JPL as it appeared in January 1959. The main road running nearly bottom to top in the picture was later named Explorer Road. The main entrance gatehouse can be seen near the bottom (west end) of that road. The long white-roofed building on the imme­diate right of Explorer Road (Building 111) was the engineering and administration building and contained Director Bill Pickering’s office. Henry Richter’s office (and my desk) was in Building 122, another white-roofed building above and to the right of Building 111 in this view. (Courtesy of NASA/Jet Propulsion Laboratory, California Institute ofTechnology.)

The location was ideal, being only a 10 minute drive from JPL, an even shorter distance from downtown Pasadena, and within walking distance from Barbara’s school.

The JPL, in late 1957 and early 1958, was a closely packed facility containing a combination of old wooden structures and a few newer, more permanent laboratory buildings. It was located at the foot of the mountains at the north end of the Arroyo Seco, about two and a half miles north of Pasadena’s Rose Bowl. Figure 8.3 shows the laboratory as it existed at about that time.

A desk, phone, and several file drawers in Henry Richter’s office served as my laboratory home away from home during my five month stay. In addition to his duties as supervisor of the JPL New Circuit Elements and Stable Oscillator Research Group, Henry served as my direct supervisor and primary interface at JPL. Throughout my stay, he helped me with outstanding competence and diligence, and we became fast friends. Although I sometimes suspected that one of his unspoken duties was to “keep that Iowa scientist out of the rest of the organization’s hair,” his role served everyone well, as he provided a well-defined conduit for my interaction with everyone at JPL.

OPENING SPACE RESEARCH

Подпись:His attention to my needs certainly helped in avoiding any confusion that might have resulted, had I been trying to make demands directly upon the many parts of the JPL organization.

I immediately set about turning over the components and equipment that I had brought in the trunk of our car. There was, of course, the operating prototype of the complete University of Iowa Vanguard cosmic ray instrument. Not only was that package studied carefully by the JPL engineers, but it also accompanied Pickering and others for showings at several press conferences and technical meetings.

Included among the components turned over to JPL were flight-worthy parts that I had procured and pretested at Iowa, including various transistors, diodes, resistors, capacitors, relays, tuning forks, and high-voltage regulator tubes. The equipment even included drilling templates that we had made for fabricating the electronic circuit boards and molds for encapsulating the completed circuits in expanded polyurethane foam.

By 22 November, I was up to speed. Van Allen had returned to the Iowa campus from New Zealand, and I was finally able to brief him on the full chain of events that had occurred since the Sputnik launch. I breathed a huge sigh of relief when he was able to resume his normal responsibilities for coordinating the University of Iowa activities.

It was not until 26 November, eight days after my arrival, that I took time off to go through the normal processing as a new employee. By that time, the Personnel Office had become so insistent that I do so that I had to steal a few hours from work to attend to those formalities.

Operations and Data Handling

W

ith the launching of the satellites, the work was only half done. Tracking the new birds, operating them, collecting their data, and processing and analyzing the data were of equal importance. The first several of those tasks are addressed in this chapter, with the data analysis effort being deferred to the next chapter.

As in the case of Chapter 5, the details in this chapter may be beyond the interest of some readers. They are included for those who may have a historical interest, or who may find them useful in their professional work. The more casual reader may wish to skip to the next chapter.

Explorer I operation

It was late evening, 31 January 1958, on the U. S. East Coast when Explorer I was launched. By then, it was early morning of the next day in Greenwich, England. It has been common for those most comfortable with local time to mark the launch date as 31 January, and for those preferring universal time to ascribe it to 1 February. Throughout this book, the 31 January convention is used.

A network of ground stations had been established for the Vanguard satellites that could provide tracking and data telemetry contact at least once each orbit. Starting with that basic array, the network evolved over time to make the coverage increasingly robust.

As an interesting side note, the Soviets did not establish a comparable worldwide network for their early Sputniks, but depended on a combination of stations within the USSR, plus coverage by radio amateurs and other volunteers who supplied some

287

OPENING SPACE RESEARCH

Подпись:tracking information. As mentioned previously, an onboard data recorder was included on Sputnik 3, but it failed before launch and was not repaired. An examination of Soviet papers reporting early results from Sputnik 3 reveals that their scientific data coverage was almost entirely limited to the region 20 degrees to 145 degrees east longitude and 42 degrees to 63 degrees north latitude, that is, over the Soviet Union.1

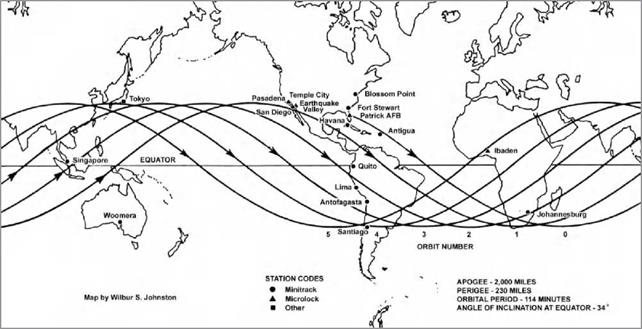
The ground paths of the first several Explorer I orbits are plotted in Figure 11.1, along with the locations of the ground stations. Although based on sparse initial tracking data, the plot from which this figure was derived was accurate enough for early satellite operation, data acquisition, and processing efforts.2 Orbit number 0 (zero) began with the satellite’s orbital injection off the Florida coast and lasted until it passed its first ascending node, that is, its first northbound crossing of the geographical equator. Subsequent orbits were numbered sequentially as the satellite passed each ascending node.

The first public report of data from the Explorer I cosmic ray instrument was issued about four weeks after the launch.3 Although that report provided an excel­lent summary of the situation as it was known then, it was based on very early and incomplete telemetry data. Much of its content dealing with the character of the cosmic ray data was modified later as data analysis progressed, especially af­ter the first data were recovered from the onboard tape recorder in Explorer III on 26 March.

The final assessment of Explorer I performance was pieced together from a large number of sources that were written over a substantial period. The most authoritative was the full tabulation of Explorer I data that was finally published about three years after the launch.4 In summary: [7]

Подпись: Special Publications Opening Space Research: Dreams, Technology, and Scientific Discovery Vol. 62

Operations and Data Handling

FIGURE 11.1 The ground tracks for the first orbits of Explorer I. This version was released less than 12 hours after the launch and was used for initial operations. Throughout the Explorer I lifetime, the orbit was refined repeatedly, as more and more extensive and accurate tracking data were obtained. Locations of the Explorer I and III tracking, data receiving, and commanding stations have been added to the original plot to indicate their relationship to the orbital tracks. (By Wilbur S. Johnston and the author, after a map produced by the Vanguard Computing Center, Naval Research Laboratory.)


Подпись: Copyright American Geophysical Union

OPENING SPACE RESEARCH

Подпись:Unexplainably, the high-power transmitter signal reappeared 11 days later, and sparse but partly readable data were obtained during four days from 24 to 27 February. It disappeared for the final time on 27 February.

There was a partial failure of the high-power transmitter’s antenna. That antenna consisted of four flexible stainless steel cables, with the base of each cable anchored at the high-power antenna insulator; a donut-shaped ring was located between the instrument payload and the fourth-stage rocket motor. The four antenna cables (which we usually referred to as whips) were connected to the transmitter through a phasing harness and served as the active elements of that circularly polarized antenna. The flexible cables can be clearly seen in the drawing of Figure 8.4 and the photograph of Figure 8.5.

It had been expected that those flexible whip elements would be held in ax­ially semirigid positions by the centrifugal force resulting from the spinning of the satellite about its long axis. That did not occur. A Jet Propulsion Lab­oratory (JPL) report dated 21 February stated that the final spin rate during rocket ascent had been as designed, at 750 revolutions per minute (rpm). That was ascertained by direct measurements via the launch vehicle telemetry system and was verified by observation of the amplitude modulation of the high-power signal caused by the normal irregularities in its radiation pattern. An abrupt drop in satellite spin rate to 570 rpm occurred about one second after comple­tion of the final fourth-stage burn. That change in spin rate was accompanied by a concurrent increase in the amplitude of the spin modulation of the radi­ated high-power signal. Those facts pointed to the loss of one of the antenna elements.5

There was a departure of the satellite’s motion in free space from that ex­pected. It showed up as a slow periodic variation in the received signal strengths from the high-power transmitter superimposed on the faster variation resulting from the satellite spin. The period of that slower variation was 6.9 seconds, corresponding to a frequency of 8.4 cycles per minute. The slower modula­tion was first seen following the postburning transient mentioned above and grew in amplitude during the first few orbits. As the slower modulation grew in amplitude, the faster modulation decreased, and it disappeared entirely after several orbits. The new slow modulation continued for the rest of the satellite’s lifetime.

That phenomenon resulted from an unanticipated resonance coupling between the spin rate of the satellite and the free-pendulum oscillation rate of the whip antennas. Those two rates turned out to be nearly the same, with the result that the whip antennas were driven to swing violently back and forth. That bending of the whips resulted in a higher-than-expected dissipation of the rotational energy of the satellite. The original spin was around the body’s lowest moment

CHAPTER 11 • OPERATIONS AND DATA HANDLING 291

of inertia—its long axis. The dissipation of kinetic energy, combined with the law of conservation of angular momentum, caused the satellite to precess in a cone of increasing opening angle. Ultimately, the satellite rotated about its transverse axis, the axis of greatest moment of inertia.6

In simple terms, the satellite was tumbling end over end, rather than spinning around its long axis, as planned.

The unexpected modulation of the transmitted signals did make it somewhat harder for the receiving stations to acquire the signals and receive the data and resulted in more data dropouts than would have occurred otherwise. That situation, fortunately, caused only a minor reduction in the usefulness of the scientific and engineering data.

The announcement

Van Allen’s quiet disclosure of our discovery to IGY program officials in Washington in April, combined with the setting of a date for a public release on 1 May, set in motion a feverish effort in our laboratory to prepare the material in a written form that would be easily understandable and thoroughly convincing.

Most of the rest of the month of April 1958 is a blur in my memory! On the first workday after my return to the Iowa campus, i. e., on the same day that Van Allen was calling Washington to reveal our initial Explorer findings, I left for Huntsville on a several days’ session for Juno II planning. In spite of the exciting revelations from the Explorer data, I had to remain heavily involved in designing our instrument for that new mission. Even that effort was soon trumped by the evolving Argus project, as detailed in the next chapter.

The two new projects had the effect of precluding my attendance at the history­making gathering in Washington, where Van Allen made the trapped radiation an­nouncement on 1 May 1958.

In preparing for the public announcement of the new discovery, Van Allen, Ernie Ray, Carl McIlwain, several other students, and I were engaged during the second half of April in working up the Explorer I and III data and preparing the written paper. Ernie Ray took the lead in the data-processing and plotting efforts, while Van, with help from Carl, Ernie, and Joe Kasper, developed the physical interpretation.

The group’s efforts during that period can best be summarized as (1) refining the plot of the GM counter response to high-intensity radiation; (2) further organizing the Explorer I data and plotting them in a suitable form; (3) plotting Explorer III

OPENING SPACE RESEARCH

Подпись: 340playback data from additional passes, to the extent that tapes were received in time; (4) developing and organizing a cogent physical explanation for the newly observed phenomenon; and (5) preparing the written paper.

Step 1: The Geiger-Miiller counter performance As soon as I arrived back in Iowa City with the spare Explorer I payload, Carl exposed it to his X-ray beam. He hardened the beam (that is, eliminated the lower-energy particles) by placing a three-eighth inch thick brass absorber between the X-ray tube and the GM counter. During his runs, he varied the X-ray tube voltage between 50 and 90 kilovolts and the distance between the X-ray tube and GM counter over a substantial range. Additionally, he used various lead shields between the source and counter. Those three techniques resulted in the production of a very wide range in the X-ray flux at the location of the counter.

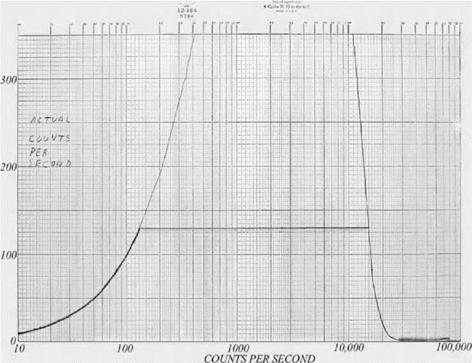
Carl produced the semilog plot shown in Figure 12.5 to portray the effect of the Explorer III onboard encoding and recording arrangement.36 Since the linear scale on the vertical axis extended only to 350 counts per second, the entire upper portion (up to an observed actual rate of more than 1400 counts per second) is cut off. The color coding described in the figure caption was used in all subsequent plots of the rates from the satellite’s GM counter.

The flat portion of the curve at 128 counts per second reflects the limitation in transmitted data rate resulting from the encoding associated with the onboard tape recorder in Explorer III. That encoding had been designed to accommodate a rate substantially greater than the maximum rate expected from cosmic rays but was, of course, completely inadequate for the unexpected intense radiation.

Interpreting Figure 12.5 in terms of the flight data, the transmitted rate accurately tracked the GM counter’s incident flux rate at values from zero to 128 counts per second. For rates increasing above 128 events per second, the onboard tape recorder encoding circuits limited the reading to that value. That persisted to a counting rate that would have been about 15,000 counts per second in a zero-dead time instrument. As the flux increased still further, the GM counter pulses piled up at the scaler input, as described earlier, so that more and more of the resulting pulses were incapable of triggering the scaler. In that region, the scaler output rate dropped off, as seen by the sharp decline between 15,000 and 30,000 counts per second near the right of the figure. With still higher incident fluxes, none of the pulses was large enough to trigger the scaler, and its output remained constant, appearing to signify a zero counting rate.

Step 2: Organizing the Explorer I data Most of the earliest work on the Explorer I data was with recordings made at the JPL Microlock stations in California (the first data recordings to arrive in Iowa City). But by 12 April, data were beginning to trickle in from Minitrack stations in South America.

We prepared many different exploratory plots in order to arrive at the most un­derstandable way of summarizing and presenting the Explorer I data.37 From those,

CHAPTER 12 • DISCOVERY OF THE TRAPPED RADIATION

The announcement

FIGURE 12.5 The response ofthe GM counter in the Explorer I spare payload upon exposure to high-intensity X-rays in the laboratory. The pencil trace above the flat region shows the rela­tionship between the incident flux and the observed counting rate from the bare GM counter as measured by a fast laboratory instrument. That curve would have peaked at a value of about 1400 ifthey-axis ofthe plot had been extended that far. The truncation at 128 actual counts per second shows the limiting effect ofthe scaler and encoding circuits. The original plot was color coded, with the ascending portion at the left being blue, the flat top green, and red for the zero level on the right. (Courtesy ofthe University Archives, Papers of James A. Van Allen, Department of Special Collections, University of Iowa Libraries.)

several formats were selected for inclusion in our announcement paper. The first was a simple plot showing the counting rate as a function of height for data received from 25 passes over the California stations.38 It convincingly conveyed a picture, even at the high latitude of those stations, of a rising intensity as the altitude increased, from counting rates of about 25 to over 100 counts per second.

As Explorer I data from locations closer to the equator were examined, the picture began to come into sharper focus. One figure included in the discovery paper showed the geographic latitudes and heights for 12 cases. The counting rates were normal in four of those cases (about 30 counts per second), no counts were observed in seven cases, and one case showed a rate in transition.39 In summary, counting rates below about 400 miles height were normal, regardless of latitude, while those above about 1200 miles appeared to be zero.

OPENING SPACE RESEARCH

Подпись:The third plot of Explorer I data included in the paper showed the results of seven high-altitude passes over the Quito, Ecuador, station and one over Antofagasta, Chile. It showed that four high-altitude passes occurring between about 0 degrees and 20 degrees south latitude produced counting rates that appeared to be essentially zero. Four other passes farther from the equator showed rates that were in transition between normal and zero counting rates.40

Steps 3,4, and 5: The Explorer III data and preparing the paper Turning to the Ex­plorer III data, the first task was to complete and refine the preliminary plot of data from the 28 March San Diego Explorer III readout that Van Allen had drawn in his hotel room. The improved full plot, included here as Figure 12.6, shows the counting rate as a function of time for the complete recorder dump.41 Although this particular plot is undated, it was probably produced at around the time of our pivotal meeting on Saturday, 12 April.

An examination of the final packing lists for the tapes produced for us at NRL revealed that copies of readouts of the onboard recorder were copied at NRL onto five reels of magnetic tape.42 The first reel, dated 4 April, contained data from nine onboard recorder readouts that took place on 27 and 28 March. The list for the second reel, dated 7 April, lists 24 data readouts that took place on 28 March-5 April. List three, dated 9 April, records 24 additional readouts. Packing list four, dated 14 April, lists 27 readouts. The fifth and final list, dated 17 April, lists 17 readouts. It can reasonably be assumed that the tape reels arrived in Iowa City shortly after the dates on those lists. The data on the first reel were of largely unsuccessful readout attempts on the first two days of the satellite life and were not useful. But reels two and three contained a gold mine of information.

Many exploratory data plots were tried. Some of them turned out to be of little use, but two turned out to be invaluable. One was a set of plots of radiation intensity as a function of height above the ground and geographic latitude for nine orbits on 28 through 31 March.43

Those nine charts were merged for the next plot, which highlighted the regions of high radiation intensity as a function of position over the globe. The original chart was color coded but was redrawn in black-and-white form for the disclosure paper.44 The information from that figure, overlaid on a world map, appears here as Figure 12.7. The oddly shaped contour marked “300” over South America and the South Atlantic shows the region where the magnetic field at the Earth’s surface is a minimum, and therefore, where the region of trapped radiation dips closest to the Earth. The figure shows the strong correlation between the highest-intensity radiation readings from the flight data (the bold segments) and the field minimum. The displacement of the bold segments somewhat to the east of the region of minimum magnetic field resulted from the fact that the satellite’s altitude was increasing during those segments and therefore climbing deeper into the radiation region.

CHAPTER 12 • DISCOVERY OF THE TRAPPED RADIATION

The announcement

FIGURE 12.6 Final plot of the San Diego station readout of Explorer III on 28 March. Since the onboard recorder playback occurred in reverse order, the right end of this plot represents the be­ginning of the recording interval, while the left end is the end of the recording and the time of the data readout. The horizontal axis scale at the top of the plot shows the actual universal time of recording. (Courtesy of the University Archives, Papers of James A. Van Allen, Department of Special Collections, University of Iowa Libraries.)

This information provided one of the most convincing arguments that the satellite was observing a region of high-intensity radiation.

Our results were first prepared as a Department of Physics research report.45 Al­though dated 1 May 1958, it was actually completed well before 28 April, since it

Подпись: 344
The announcement
Подпись: FIGURE 12.7 Plot of Explorer III onboard-recorded GM counter data for portions of nine orbits during the four day period 28-30 March 1958. The smooth arcs show the paths of the satellite over the Earth's surface during periods when data were recovered. The light solid segments represent regions in which the counting rates were less than 128 counts per second (where the satellite was below the trapped radiation region). The bold segments represent regions where the counting rates were greater than 15,000 counts per second and therefore reflecting the high-intensity radiation. The segments with ovals are regions in which the counting rates were in the transition region between the low and high values. The dashed segments represent regions of uncertain data. The contours marked 300 and 600 are magnetic field values at the Earth's surface during the 1955 era. (Figure by the author. Original data plots courtesy of the University Archives, Papers of James A. Van Allen, Department of Special Collections, University of Iowa Libraries.)

had reached Washington and was being distributed on that date, marked “Release May 1.”

Our report’s opening included a brief, simple summarizing statement:

[We] conclude that [the blanking of the G. M. counter] is not due to equipment malfunction, but is caused by a blanking of the Geiger tube by an intense radiation field. We estimate that if the Geiger tube had had zero dead time, it would on these occasions have been producing at least 35,000 counts/sec.

It continued with a discussion of the instrument and a more complete summary of the preliminary observations. A third major section contained an interpretation of the data that served to justify the claim that the zero counting rate resulted from exposure to very intense radiation. The concluding section, dealing with implications, dwelt on three major points:

The particles are unlikely to have as much as several BeV of energy each. They must initially be associated with plasmas that seriously perturb the magnetic field at an Earth radius or so.

CHAPTER 12 • DISCOVERY OF THE TRAPPED RADIATION

The energy loss in the residual atmosphere above 1000 km may contribute significantly, if not dominantly, to the heating of the high atmosphere.

There are obvious biological implications of the results.

Throughout this chapter, the singular term region of high intensity radiation, Van Allen Belt, or some variation has been used to describe the discovery. This emphasized the fact that, at first, we thought that we were dealing with a more or less homogeneous phenomenon located in a single large region around the Earth. A little later, after examining the data from Explorer IV and Pioneer 3 (as described in the following chapters), it became clear that there were two distinct regions. Soviet data substantiated that finding. After that, the collective term Van Allen Radiation Belts (plural) was widely used.

An early scorecard

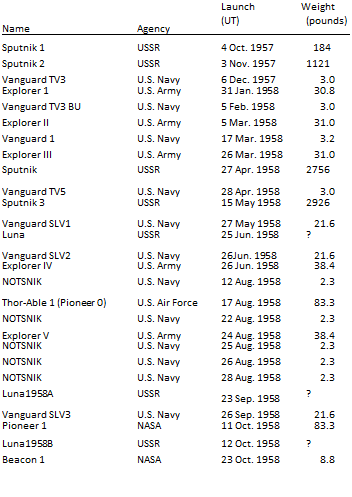
It is obvious from the litany of failed space launches already mentioned that the initial foothold in space was somewhat tenuous. During the first year of the Space Age (4 October 1957 to 4 October 1958), a total of 24 attempts were made by the United States and the USSR to launch into Earth orbit and beyond, of which only seven were successful. Extending the period to encompass the first two years, a grand total of 54 space attempts were made, of which 20 were at least reasonably successful. During those two years, 34 failed attempts ended up as piles of flaming debris on the launch pads, down range, or in premature watery graves.

To provide a broad perspective of those first two years, all the launch attempts during that period are listed in Table 14.1. In spite of the huge disappointments in the failures, all the attempts helped in one way or another to develop the technology and infrastructure that led to the incredibly exciting and productive space program that followed.

Подпись: Copyright American Geophysical UnionПодпись: Name Agency Launch (UT) Weight (pounds) Sputnik 1 USSR 4 Oct. 1957 184 Sputnik 2 USSR 3 Nov. 1957 1121 Vanguard TV3 U.S. Navy 6 Dec. 1957 3.0 Explorer 1 U.S. Army 31 Jan. 1958 30.8 Vanguard TV3 BU U.S. Navy 5 Feb. 1958 3.0 Explorer II U.S. Army 5 Mar. 1958 31.0 Vanguard 1 U.S. Navy 17 Mar. 1958 3.2 Explorer III U.S. Army 26 Mar. 1958 31.0 Sputnik USSR 27 Apr. 1958 2756 Vanguard TV5 U.S. Navy 28 Apr. 1958 3.0 Sputnik 3 USSR 15 May 1958 2926 Vanguard SLV1 U.S. Navy 27 May 1958 21.6 Luna USSR 25 Jun. 1958 ? Vanguard SLV2 U.S. Navy 26Jun. 1958 21.6 Explorer IV U.S. Army 26 Jun. 1958 38.4 NOTSNIK U.S. Navy 12 Aug. 1958 2.3 Thor-Able 1 (Pioneer 0) U.S. Air Force 17 Aug. 1958 83.3 NOTSNIK U.S. Navy 22 Aug. 1958 2.3 Explorer V U.S. Army 24 Aug. 1958 38.4 NOTSNIK U.S. Navy 25 Aug. 1958 2.3 NOTSNIK U.S. Navy 26 Aug. 1958 2.3 NOTSNIK U.S. Navy 28 Aug. 1958 2.3 Luna1958A USSR 23 Sep. 1958 ? Vanguard SLV3 U.S. Navy 26 Sep. 1958 21.6 Pioneer 1 NASA 11 Oct. 1958 83.3 Luna1958B USSR 12 Oct. 1958 ? Beacon 1 NASA 23 Oct. 1958 8.8 Подпись: TABLE 14.1Подпись:Подпись: Apogee (miles) 583 1131 1583 Подпись: 2421 1739 Подпись: 1158Подпись: 1375Подпись: 70,750Perigee

(miles) Comments

134 First satellite

132 Carried dog Laika

Lost thrust at two seconds 221 First U. S. satellite

Control system malfunction No fourth-stage ignition 406 First Vanguard success

116 First full-orbit data coverage

Failed to reach Earth orbit No third-stage ignition

135 USSR Primary IGY satellite Improper third-stage trajectory

Moon attempt; failed to reach Earth orbit Premature second-stage cutoff 163 Participated in Argus project

Argus; no verifiable orbit Moon attempt; first-stage malfunction Argus; no verifiable orbit Upper stages aimed incorrectly Argus; no verifiable orbit Argus; no verifiable orbit Argus; no verifiable orbit Moon attempt; failed to reach Earth orbit Insufficient second-stage thrust

Moon attempt; distance record but failed to reach Moon Moon attempt; failed to reach Earth orbit Upper stages separated prior to burnout

Подпись: Special Publications Opening Space Research: Dreams, Technology, and Scientific Discovery Vol. 62

Pioneer 2

NASA

8 Nov. 1958

86.2

No third-stage ignition

Luna1958C

USSR

4 Dec. 1958

?

Moon attempt; failed to reach Earth orbit

Pioneer 3

NASA

6 Dec. 1958

13.0

63,590

Moon attempt; failed to reach Moon

SCORE

ARPA

18 Dec. 1958

8737

922

114

Sent Christmas message

Luna 1

USSR

2 Jan. 1959

796

~122 million

~90 million

Passed within 3727 miles of Moon

Vanguard II

NASA

17 Feb. 1959

21.6

1952

347

Satellite wobble degraded data

Discoverer 1

U. S. ARPA

28 Feb. 1959

1363

601

101

First polar satellite; no reentry capsule

Pioneer 4

U. S. NASA

3 Mar. 1959

13.0

~106 million

~92 million

Passed within 37,301 miles of Moon

Discoverer 2

ARPA

13 Apr. 1959

1638

215

149

Capsule ejected but lost in Arctic

Vanguard SLV5

NASA

13 Apr. 1959

22.7

Second stage damaged on separation

Discoverer 3

ARPA

3 Jun.1959

1660

Failed to reach Earth orbit

Luna

USSR

18 Jun. 1959

?

Moon attempt; failed to orbit Earth

Vanguard SLV6

NASA

22 Jun. 1959

22.7

Second-stage propulsion malfunction

Discoverer 4

ARPA

25 Jun.1959

1660

Insufficient second-stage velocity

Explorer S-1

NASA

16 Jun. 1959

91.3

Off course; destroyed by range safety officer

Vostok

USSR

18 Jul. 1959

?

Early unmanned test of satellite for manned flight; failed to reach Earth orbit

Explorer 6

NASA

7 Aug. 1959

141

26,350

152

Highly eccentric orbit

Discoverer 5

ARPA

13 Aug. 1959

1722

174

88.9

Capsule orbited

Beacon 2

NASA

14 Aug. 1959

9.9

First-and upper-stage malfunction

Discoverer 6

ARPA

19 Aug. 1959

1726

527

132

Capsule ejected; recovery failed

Luna 2

USSR

12 Sep. 1959

853

Flight time 34.0 hours; impacted Moon

Transit 1A

ARPA

17 Sep. 1959

262

Third-stage malfunction

Vanguard III

NASA

18 Sep. 1959

50.7

2190

319

Final Vanguard launch

Atlas-Able 4A (Pioneer)

NASA

24 Sep. 1959

?

Failed

Luna 3

USSR

4 Oct. 1959

614

296,100

25,040

Photos of Moon’s far side


Подпись: Copyright American Geophysical Union

Setting the Stage at the University of Iowa

B

alloons led the initial forays into near space for scientific research. Victor F.

Hess, during a balloon flight in Austria on 7 August 1912, conclusively showed the extraterrestrial origin of cosmic rays.1 That event marked the beginning of an extraordinary chapter in the history of science, in which balloon-based research played an important role.2

Cosmic rays are nuclear particles that travel at extremely high speed. They originate in extraterrestrial space, probably mostly in supernovae. They consist of protons (hydrogen nuclei), alpha particles (helium nuclei), and lesser numbers of higher – charged atomic nuclei, as well as some electrons and photons. Most of the cosmic rays approaching the Earth collide with atoms and molecules in the upper atmosphere to produce showers of secondary radiation. Because few of the primordial cosmic rays ever reach the Earth’s surface, it is necessary to study them from as high above sea level as possible. Balloons remain an important vehicle for their study.

The use of rockets for this purpose was seriously discussed as early as 1929 when, at a meeting in the home of John C. Merriam, then president of the Carnegie Institution in Washington, D. C., one of the attendees optimistically asserted that if a rocket went more than 50 miles high, above the ozone layer, it would “settle the nature of cosmic rays.”3 In 1931, Robert Millikan at the California Institute of Technology tried to persuade Robert H. Goddard to use the high-altitude rockets that he was developing in New Mexico for cosmic ray research. However, Goddard, having become by that time apprehensive about collaborative arrangements and, as a result, an inveterate loner in his rocket work, shied away from such joint endeavors.4

Even during the development of the V-2 rocket (Vengeance Weapon Number 2) in Germany during World War II (WWII), serious thought was given by its designers

5

6 OPENING SPACE RESEARCH

to using it for high-altitude research and space travel, but those thoughts had to be set aside because of the high wartime priority given to developing the weapon. In fact, project technical leader Wernher von Braun and two other staff members were imprisoned by the German Gestapo for two weeks in March 1944—charged with diverting their full attention from their wartime duties by planning to use rocketry for space travel.

An interesting vignette in that connection was related by Ernst Stuhlinger, one of von Braun’s close associates. In the fall of 1944, he visited his former mentor, Professor Hans Geiger, where he lay near the end of his life in a Berlin hospital. Geiger asked his former student what he was presently doing. Stuhlinger replied, “We are working on a long-range precision rocket which, we hope, will be able one day to fly to the Moon.” Stuhlinger went on to explain that he was working on the guidance system that would make it possible. Geiger’s interest was piqued, and he asked, “Do you think you could put a cosmic ray counter on board? And transmit the pulse signals to the ground? And really measure the cosmic ray intensity at high altitudes, far above the atmosphere?” Stuhlinger replied, “Absolutely, and we will certainly not send any of our rockets into space without some scientific instruments on board!”5

It was not until peace followed WWII that the first scientific instruments were carried aloft by rockets. The vehicles first used for that purpose were the captured German V-2 rockets that had been brought to the United States after the war, along with a cadre of senior German scientists and engineers led by Wernher von Braun. The primary purpose of the U. S. V-2 work was to help jump-start a nascent American rocket program.

Fortunately, the German team, with the support of their U. S. associates, followed through on the promise that the rockets would serve a useful purpose by carrying meaningful scientific instruments. By the end of 1950, approximately 63 V-2s had been launched in the United States, most with an assortment of research instruments. Strong leadership for the developing U. S. research program that employed the V-2s was provided by (in simple alphabetical order) Homer E. Newell Jr. (Naval Research Laboratory, NRL), William H. Pickering (Jet Propulsion Laboratory, JPL), Milton W. Rosen (NRL), Homer Joe Stewart (JPL), John W. Townsend Jr. (NRL), and James A. Van Allen (Applied Physics Laboratory, APL). Those individuals all went on to figure prominently in developing the follow-on research rockets and the first U. S. satellites.

New vehicles for high-altitude research were soon developed in the United States, most notably, the Women’s Army Corps (WAC) Corporal by the JPL in California; the Aerobee, developed jointly by the APL and the NRL; and the Viking, developed by the NRL. By the end of 1950, approximately 10 of the WAC Corporals, 50 of the Aerobees, and 7 of the Vikings had been launched.

A more complete discussion of those rocket developments is contained in Chapter 7.

CHAPTER 1 • SETTING THE STAGE AT THE UNIVERSITY OF IOWA 7