Laurence (Larry or Bud) James Cahill was born on 21 September 1924 on the family farm southeast of Bangor, Maine. He spent his childhood with his parents in Bangor, where all of his early memories are focused. He attended kindergarten, grade school, and high school in Bangor’s public schools.24
Larry developed a strong interest in science at an early age. Throughout his secondary and primary school years, Larry gained access to reading material through the excellent library situated next to the high school. He visited it several times a week to check out books and magazines. Although the subjects varied widely, he particularly liked the Popular Mechanics and Popular Science magazines. Academically, Larry doesn’t consider himself to have been an outstanding student throughout his primary and secondary school years, but he did well in the subjects he liked, including mathematics, history, and chemistry. Larry graduated from high school in June 1942.
Recipient of a university scholarship at the University of Maine at Orono, Larry attended that school for the 1942-1943 academic year. Because of his high school focus in chemistry, he enrolled initially in chemical engineering. Soon disenchanted with the laboratory work in chemistry, he was attracted to physics, in which the university had an excellent program.
It was wartime, and Larry had enrolled in the Navy V-6 program in order to remain at the university. However, after the first year there, he yearned for a change and entered the competition for further schooling at the U. S. Naval Academy in Annapolis. Although he lost out on an appointment there (because of politics rather than lack of qualifications), he did win an appointment to the Army’s West Point, which he entered in June 1943. He spent the next three years there, during which time he also went through the Army Air Corps pilot-training program. Graduation in June 1946 was from both West Point and the flying school.
Following graduation, he took an assignment in the Air Corps in which he flew a progression of fighter aircraft, beginning with transition training and then assignments in the F-51.
In mid-1947, he trained in the new F-80 jet fighters and flew them extensively during the next few years.
While in military service in what was by then the U. S. Air Force, Larry received his B. S. degree in physics from the University of Chicago in June 1950. He followed that with Air Force Special Weapons (to be understood as the atomic bomb) training at Albuquerque, New Mexico. He served from the fall of 1951 until August 1953 in French Morocco as the arming officer for atomic bombs in the heavy bombardment wing that was stationed there.
Larry left the air force in the summer of 1954 to pursue further university study. After visiting the campuses of the universities of Minnesota and Iowa, he decided to join the space research program at Iowa. Moving to Iowa City that summer with his wife, Alice, and their first two sons, Larry and Tom, he registered as a Physics Department graduate student for the beginning of the fall 1954 semester.
Discovering the possibility of employment in the Cosmic Ray Laboratory, Larry began work there soon after the start of his course work. Although Larry had had more formal academic training than the rest of us when we began work there, he quickly joined in the spirit of the laboratory, undertaking any tasks that needed to be done.
Larry received his M. S. degree in 1957 and his Ph. D. degree in the spring of 1959. That summer, he moved into a faculty position at the University of New Hampshire, where he led a first-rate space research group that is still active today. After nine years there, he
OPENING SPACE RESEARCH
 joined the space research group at the University of Minnesota, where he served as one of its prominent researchers and departmental leaders. He remained there until retirement in 1989.
After retirement, Larry and Alice stayed in their home in Avon, east of the Twin Cities in Minnesota, for a number of years. In early 2001 they moved into Academy Village, a new community for academic retirees located about 20 miles east of the center of Tucson, Arizona. Alice died unexpectedly in 2009, but Larry continues to enjoy his residence in Academy Village.
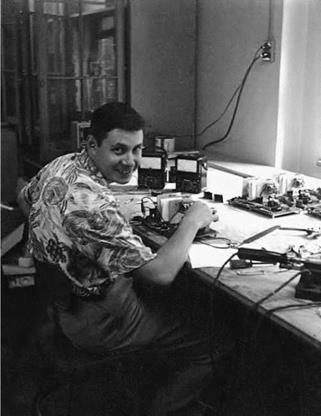
Larry quickly began to develop the magnetometer. His twin scientific objectives were the study of the equatorial electrojet and a search for ionospheric electrical currents in the auroral zones. He later confessed that he didn’t know much about electronics at the time, but he promptly set about to learn what he needed to know.
His greatest challenge was to detect and isolate a very low level audio frequency signal from the instrument’s detector coil. That required an extremely high gain amplifier, sharply tuned to the expected proton precession frequency in order to separate the useful signal from the noise occurring at all frequencies. He found it very tricky to adjust that amplifier so that it had sufficient gain but did not break into continuous oscillation. Larry underscored that problem during our October 2000 interview:
My principal problem was oscillation of the high-gain, narrowband, tuned circuit, because it really was an oscillator, or very easily became an oscillator. [There was] a coil pickup— essentially a high-gain antenna—and a high-gain amplifier, all without shielding. [The components] were all in close proximity. I made tremendous efforts to work around [the problem, including twisting things, etc.]. … I can’t say that I ever completely solved that problem.
I [eventually] built 25 rocket [instruments], and some of them were quite stable against oscillation—some I couldn’t ever stop oscillating, and I didn’t ever fly them. It was a problem that never went away.25
After getting the instrument to work in the laboratory, Larry developed a version for a balloon flight to demonstrate that it could be made to work under field conditions. That balloon flight was made in early 1956, as described in Chapter 2. On that first flight, the instrument operated perfectly, successfully tracing the strength of the magnetic field at flight altitude from Iowa City to the vicinity of Chicago. Of course, no ionospheric current was expected or seen at that height or latitude—the flight was strictly for developmental purposes. The technical development and the balloon flight results were fully described in Larry’s master’s thesis.26
Larry then undertook the adaptation of his magnetometer for flight in the Loki rockoons. The primary change from the balloon hardware was the ruggedization necessary to withstand the extreme vibration and acceleration of the rocket during its burning. Although the instrument was not required to operate during the actual firing, it had to survive launch and commence normal operation immediately thereafter. Most
|
CHAPTER 4 • THE IGY PROGRAM AT IOWA
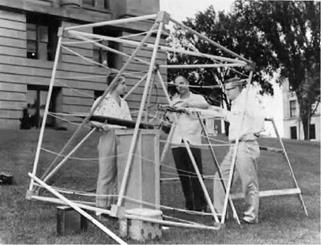
FIGURE 4.4 Setting up for a test of one of Larry Cahill’s Loki II proton precession magnetometers on the west lawn of the physics building. The instrument is located on the wooden pedestal in the center of the large coil. Larry, in the center, is flanked by two student assistants. The Cosmic Ray Laboratory was in the basement corner of the physics building shown in the background. (Courtesy of Laurence J. Cahill Jr.)
|
of the rockoon circuitry employed the Raytheon subminiature tubes that were being used at Iowa for most of the rockoon instruments. The transmitter still employed a larger vacuum tube, the same RCA type 3A5 acorn tube as was used in most of the Iowa balloon and rockoon instruments.
Larry, with help from undergraduate assistant Gary Strine, built, tested, and adjusted the instruments. The testing and calibration included running back and forth between the laboratory and the yard on the west side of the physics building. There he set up a large coil to produce a magnetic field at its center that was equal to the one expected at flight altitude and latitude. With his instrument at that center location, as shown in Figure 4.4, they were able to tune the circuits for the expected conditions at their planned flight locations.
The next step was to make a test firing of a rocket carrying his instrument to check the instrument’s ability to operate at altitude after the trauma of the rocket firing. For that purpose, Larry joined the Iowa contingent’s expedition to Guam in January-February 1957, as mentioned earlier. He took three of his rockoon payloads for that first field test. He attempted to fly them in mid-February 1957. Unfortunately, that expedition did not produce useful results. He tried to launch from a small Navy Landing Ship, Tank (LST), but only two days were allotted for the exercise, and the team was unable to get the rocket and supporting equipment ready in time. Larry finally tried a ground rocket launch from a crude launcher, but he received the radio signal from the ascending rocket for only a few seconds.27
OPENING SPACE RESEARCH
 In spite of that early failed attempt to field test his evolving instrument, Larry’s hard work did eventually pay off. He later conducted a very successful set of field rockoon operations with his magnetometer, as described later in this chapter.
Van Allen’s 1957 Loki II instruments The instruments that Van Allen took on his 1957 Arctic and Antarctic expeditions were reasonably straightforward derivatives of the instruments that Carl Mcllwain had developed and flown during his 1955 Arctic expedition. Van was assisted in that effort by graduate student Donald (Don) Goedeke and undergraduate assistant Donald (Don) E. Simanek.
Van Allen’s scientific objectives were as follows:
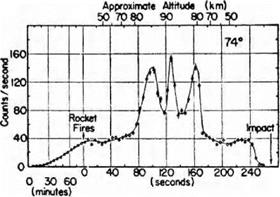
• To investigate the physical nature, energy, intensity, and latitude distribution of the auroral soft radiation that had been discovered on the earlier rockoon expeditions, including extension of the observations to the southern hemisphere.
• To investigate the total cosmic ray intensity through and above the atmosphere at various northern and southern latitudes during the period of maximum sunspot activity. This was a continuation of the original rockoon objective that he had laid out in 1951.
• To study the correlation of fluctuations of cosmic ray intensity with solar and magnetic data from ground stations, with cosmic ray data in balloon flights at Fort Churchill, Canada, and Minneapolis, Minnesota, and with neutron monitor data at various ground stations. This was a broader objective intended to supplement the wide range of observations being made under the IGY umbrella.
As his basic detector, his instruments employed the same type of Victoreen 1B85 GM counter that had been used in most of the Iowa balloon and rockoon instruments, beginning with Meredith’s first balloon flights in 1951. Two counters were used in each payload, one without shielding other than the counter wall and nose cone shell. The second counter had various amounts of either aluminum or copper shielding, in order to obtain improved information about the auroral soft radiation particle types and energies.
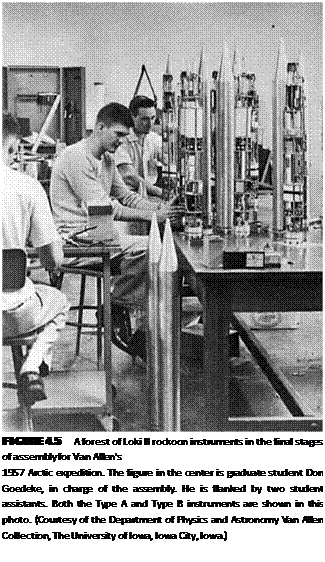
Two instrument types were identified in various logs and papers as Type A and Type B. As far as can be determined, the detector arrays in the two types were similar, but the Type B instruments contained different electronics, including a different way of modulating the transmitter. The payload weights were 8.5 pounds for the Type A and 11.5 pounds for the Type B instruments.
Van Allen and Cahill to theArctic The Iowa members of the 1957 Arctic expedition, Van Allen, Cahill, and undergraduate students Don Simanek (assisting Van Allen) and Gary Strine (assisting Cahill), joined their ship, the USS Plymouth Rock, at Norfolk, Virginia, where they helped load their instruments and set up their onboard laboratory.28 The ship was a Landing Ship Dock (LSD-29), a much later model of the
CHAPTER 4 • THE IGY PROGRAM AT IOWA 107
ship that supported the 1955 rockoon expedition. It provided plenty of space for all of the helium bottles, supplies, rocket storage, and laboratory and for launching the rockoons from its helicopter deck.
The ship was commanded by Captain J. D. Lautaret, USN. Its primary mission was to resupply several American bases in Greenland. As on previous expeditions, the rockoon support was an add-on mission, with the ship pausing en route to launch the rockoons. A reasonable distribution of launch positions was planned, extending from about halfway between the northern tip of Newfoundland and the southern tip of Greenland, up the Davis Strait and Baffin Bay, to Thule, Greenland, the turnaround point. (See Figure 2.13 for a general orientation.)
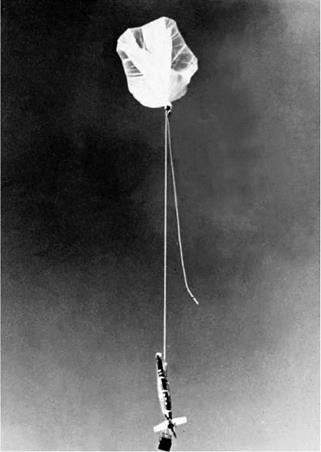
The rockets employed for all launches on this expedition were modified Loki Phase II rockets, known by then as the Hawk, an improved version of the Loki Phase I rockets used on the 1955 expedition. Their greater propulsion capability permitted flights to higher altitudes and/or with greater payload weights. The basic propulsion unit was a solid-fuel cylinder three inches in diameter and five feet long. As with the earlier Phase I rockets, its fins were larger than the standard production fins to stabilize the rocket when it was fired in the rarified upper atmosphere. The basic rocket’s modifications also included an attachment hook for suspension from the balloon and a modified forward end for attachment of the instrumented nose cone. The nose cones were, as before, three inches in diameter and about three feet long, as seen in Figure 4.5.
Balloons from Raven Industries were used for those flights. They were made of 15 60 foot long gores of 0.00075 inch thick Visqueen-A laminated polyethylene, joined to form an approximate 38 foot diameter sphere, with an attached 50 foot long inflation tube. Partly inflated at sea level, the helium expanded during ascent to create an inflated volume of 28,000 cubic feet. The material of the balloons weighed 17.5 pounds, and they reached a maximum altitude of 82,000 feet (over 15 miles) with a 42.5 pound payload consisting of a rocket and its instrumented nose cone.29
The costs of the flights were unbelievably low, even by the standards of the time. In 1959 dollars, the costs for the rockoons were $580 each for the Hawk propellant units, $40 for the firing boxes, $100 for the balloons, $30 for the helium, plus the money provided to the university for instrument development and fabrication.
The ship departed from the naval shipyards at Norfolk on 1 August 1957, passing up the New England coast, across the Grand Banks off the east coast of Newfoundland, and then on an essentially direct course to its first port of call at Sondre Sund, about halfway up the west coast of Greenland. While thus sailing south of, completely through, and above the main auroral zone, they launched two of Cahill’s magnetometers and three of Van Allen’s instruments. Four of the five achieved useful balloon altitude. One of Cahill’s instruments provided usable data during the rocket phase. Two

OPENING SPACE RESEARCH
of Van Allen’s instruments provided good balloon phase data, and one also produced usable rocket phase data.
The stop at Sondre Sund on 7 August was brief, with departure later the same day. The next leg to Thule was made rather quickly, with only two launches en route. Cahill’s one attempt ended in failure of the rocket to ignite, while Van Allen’s provided good balloon and rocket phase data.
The ship stayed at Thule for a brief day or two, and then departed for its southward return. Van Allenmade a cluster of three launches atabout 77 degrees north geographic latitude, well north of the auroral zone, of which two produced good balloon and rocket data, while the last one, carrying the first of his three new Type B instruments, experienced another rocket igniter failure.
CHAPTER 4 • THE IGY PROGRAM AT IOWA 109
From there, the ship sailed uninterrupted for about 15 hours, by which time they were again approaching the zone of the visible aurora. During the next three days, the team launched eight more rockoons. Two of those were Cahill’s, of which one experienced instrument failure, while the other reached a satisfactory rocket altitude but apparently failed to produce scientifically useful data. Of Van Allen’s six attempts, one rocket failed to fire, and three other flights experienced instrument problems. Thus, Van’s southbound auroral zone flights produced five sets of balloon data, but only two sets of usable rocket data.
It should be noted that the balloons performed admirably throughout that expedition, with all but one of the 18 launch attempts reaching a verifiable balloon altitude. That one may also have been successful, but transmission from the scientific instrument ceased early in the flight. Problems were encountered, however, with quite a few of the rockets and scientific instruments. There were four cases of failure of the igniters to fire. The instrument on another flight froze out before the rocket fired. And in three cases, the instruments failed after the rockets were fired, but before they reached usable altitude.
The final tally for the northward expedition included one fully successful flight out of five attempts with Larry’s magnetometers. Van Allen obtained useful data from the balloon phases of 11 of his 13 flights, but only 6 of those flights produced usable rocket phase data. In spite of those rather disappointing results, the expedition did provide important new scientific information, as outlined later.
The ship returned to its homeport at Norfolk on 20 August.
The IGY effort at the University of Iowa was a large one, putting considerable strain on the Physics Department. Funding was always a problem. By mid-September 1957, the situation had become especially critical. Van Allen met with Frank McDonald, Kinsey Anderson, Carl McIlwain, Larry Cahill, and me on 16 September to agree on programmatic changes to bring the endeavor within our overall IGY budget. That meeting produced a list of actions, the most notable being a reduction in the number of Cajun sounding rockets and in instrument development for Anderson’s program, a reduction in the number of personnel to accompany the upcoming mid-Pacific/Antarctic expedition, and a reduction in the early 1958 schedule of Nike-Cajun firings. Those changes were accompanied by a general tightening of the effort within the laboratory to conserve resources, as well as several efforts to obtain additional funding.
And south to the Equator and Antarctic As soon as the Van Allen-Cahill team returned to Iowa City from the Arctic expedition, they began a frantic period of activity before departing southward less than five weeks later. The first order of business was to complete the instruments that were in the final stages of assembly and checkout.
OPENING SPACE RESEARCH
 Larry and his team produced 20 instruments for the next voyage, of which 18 would be expended in flight attempts. With only minor exceptions, his instruments for the southbound expedition were identical to those flown on the Arctic expedition. He worked mightily during this short period to improve the troublesome tuning of the amplifiers in order to reduce their tendency to break into oscillation.
Don Goedeke and his helpers were working to complete the instruments for Van Allen’s flights, of which 17 would be launched. Nine of those 17 contained single GM counters for use at relatively low latitudes for the cosmic ray survey. The other eight contained the multiple counters described earlier, one relatively unshielded, and the other shielded by various amounts of aluminum or copper in order to search for and study the soft X-radiation in the southern auroral zone (in addition to continuing the latitude survey there).
Van Allen was heavily occupied during that period with coordinating the coming expedition’s efforts in Washington. In addition, he had his duties as head of the Physics Department as it entered the new semester and was busily engaged in his many planning and coordination duties for the IGY.
Both Van Allen and Cahill also rushed, during that short period, to complete papers being prepared for the upcoming CSAGI Conference on Rockets and Satellites that began on 30 September. They primed me to present their papers while they were on their expeditions.
In late September, Van Allen and Cahill departed from Iowa City with their instruments and laboratory equipment to join the ship at the Navy yard at Boston. The two constituted the entire Iowa contingent—the cost-cutting actions mentioned above excluded other helpers.
The ship was the USS Glacier, a new, larger, and highly improved class of Navy icebreaker.30 Navy Commander B. J. Lauff served as its commanding officer. Its primary mission was to cruise from Boston to the Antarctic at the beginning of Operation Deepfreeze III. Agreement was reached for the icebreaker to support the rockoon expedition by deviating from its normal direct course from the Panama Canal to the Antarctic by first progressing nearly due west to the equatorial region south of Hawaii.
Throughout the expedition, the researchers were helped by another very competent liaison officer, Lieutenant Junior Grade Steven (Steve) Wilson. His primary assignment was to coordinate the research activities with the ship’s crew, but he also helped actively in preparing and launching the rockoons. He proved to be a tremendous asset—enthusiastic and interested—always wanting to know how everything worked.
The ship left Boston on 23 September. During the passage south toward the Panama Canal, the team launched two rockoons, being careful to stay well away from the normal shipping lanes. The first launch, made well out to sea from Georgia, without an operating payload, was a test flight to check out the launch procedures and rocket.
CHAPTER 4 • THE IGY PROGRAM AT IOWA 111
The next day, well off the coast of Miami, they made their first research flight with one of Van Allen’s cosmic ray instruments. He was encouraged by that successful initial flight, unmindful of the later problems that were to beset him.
After transiting the Panama Canal near the end of September, the ship put in at Balboa, where it remained for several days. During that stay, in addition to helping with the shipboard preparations, Van Allen was very busy on the telephone, following up on expedition arrangements, on his various responsibilities for the IGY, and as head of the Iowa Physics Department.
Van Allen also continued to work with his instruments, which were proving to be even more troublesome than on the Arctic expedition. Larry recalled that, back in the Iowa laboratory during the summer, Don Goedeke appeared to be having problems in preparing them. Don’s many questions dealt with such elementary things as construction practices, transmitter tuning, etc. At the time, being heavily occupied with his own work, Larry didn’t realize how serious the problems were with the cosmic ray instruments. As it turned out, it was necessary for Van Allen, throughout the entire southward voyage, and assisted at times by Larry, to do “an awful lot of work to try to get some of them to work.”31
While in Panama, they loaded additional helium for the balloons. Somehow, in that process, Van Allen received a deep gash in his leg that proved to be a serious problem during the next few weeks.
Larry’s objective for the Arctic and Antarctic expeditions was a comprehensive investigation of electrical currents in the ionosphere. An important part of that program was to look for, and measure, the equatorial electrojet, a current believed to be flowing in the ionosphere in the region of the equator. He decided that launches near the Line Islands south of Hawaii, specifically in the region between Christmas and Jarvis islands, would provide the best conditions for meaningful results. That was because the Earth’s geographic and geomagnetic equators intersect there, and the strongest indication of the small change in the magnetic field would be measurable with his proton precession magnetometer. In addition, that was the location of a number of ground observatories, established as part of the IGY program, whose ground observations would help in interpreting his flight results.
The break at Panama provided an excellent opportunity for Larry Cahill to tweak his magnetometers. It happened that the magnetic field at Balboa was close enough to that expected at the planned equatorial launch site that he was able to tune the instruments there for optimum performance when launched.
The first of Van Allen’s two primary objectives was to continue the latitude survey of the primary cosmic rays. That called for launches of his counters from a wide variety of geographical locations, including measurements at the equator.
OPENING SPACE RESEARCH
 Van Allen launched one of his single GM counter instruments during the morning of 4 October, soon after leaving Balboa, while the ship was somewhat north of the Galapagos Islands. That flight was encouraging, as it produced useful data from both the balloon and rocket phases. From that point on, things took a discouraging turn. The next weeks certainly must have been among the most frustrating and stressful of Van Allen’s life, for three reasons.
First, he continued to be beset by the many problems with his instruments. In spite of hard work throughout the rest of the expedition, he had very limited success in achieving fully successful rockoon flights. It was not until nearly a month later, after 10 more attempts, that he was able to achieve another successful high-altitude rockoon flight.
Second, on the day of his first Pacific launch, the world was ushered into a new era by the Soviet launch of the first artificial Earth satellite, Sputnik 1. And there was Van Allen, on a ship in the Pacific Ocean, essentially out of touch with all of the space – related action that he had helped set in motion through his vigorous participation in the planning and conduct of the IGY!
Both Van Allen and Cahill have described the excitement on the ship as word was received of the Soviet launch. The first announcement had been received in the United States from an Associated Press wire from Moscow at about 6:30 PM EST. The story of its announcement at the Soviet Embassy is related in Chapter 6. That announcement would have been at about 5:30 PM local time on the ship, and they received the news very promptly via Armed Forces Radio. Van Allen’s account, as recorded in his field notebook and quoted in his book Origins of Magnetospheric Physics, was as follows:
Yesterday night the 4th and early this morning were very exciting for me (as well as for the civilized world in general).
Just before dinner time Larry Cahill told me that news was just coming in on the ship’s news circuit that the Soviet Union had successfully launched a satellite [emphasis his]. Factual details as follows:
Inclination of orbit 65° to Earth’s equator. Diameter 58 cm. Weight 83.6 kilogram (Wow!). Estimated Height 900 kilometers (Perigee or Apogee?) Period 1h 35m.
Transmitted Signal: 20.005 Mc/sec and 40.002 Mc/sec with switching alternately from one to the other—spending about 0.3 sec on each frequency. Would pass over Moscow at 1:46 A. M. and at 6:22 A. M. on the 5th, Moscow time. (Moscow is -3, or rather +21 zone time from Greenwich.)
Our Ship’s Position ~5° 30′ N, 92° W (+6 zone time)
After dinner (and a very poor movie), I went up to the communications shack to see if there was any further news available (about 2120 Ship’s time (+6)). As I walked in to look at the teletype machine a young radioman (David Armbrust RM 3/c) wearing a pair of earphones and hovering over one of the ship’s communications receivers turned to me and said, “I think that I have it!” This was at 2120 (zonetime of October 4) or 0320 Z (Greenwich Time) of the 5th of October. I listened to the phones and heard a repetitive Beep-Beep-Beep-etc. of an audio frequency tone—loud and clear. The r. f. frequency was very nearly 20.005 Mc/sec. I had earlier considered using our Clarke receiver but recalled that 55 Mc/sec was [its] lowest
CHAPTER 4 • THE IGY PROGRAM AT IOWA
frequency. Then I briefly considered the ship’s capabilities but (too hastily) discarded this possibility on the general impression that the signal would be quite weak ala U. S. plans and that the ship’s communications gear would be inadequate in basic noise level.
However, Mr. John Gniewek (with a B. A. in physics from Syracuse Univ.), young civilian employee of the U. S. Coast and Geodetic Survey, who was a passenger on the Glacier going to the Antarctic to operate a magnetometer station there for the coming year, had been up to the communications shack earlier and had inquired if they could receive it. Armbrust had started looking with first success at ~0320 Z. He had also run a receiver calibration and had been listening and searching assiduously for some minutes.
My first reaction was: Could it possibly be true that this was the satellite’s transmission? (Not a spurious effect of some kind—or something from WWV at 20.000 Mc/sec.)
At about this time Gniewek came up. He listened, also excitedly. It immediately occurred tome that we should make a recording! I thought of our Ampex [tape recorder] in the rockoon lab but was somewhat discouraged of hauling it up to the comm. shack because of its weight and the way in which it was “built-in” to Cahill’s apparatus! I remarked on this to Gniewek!
He immediately responded that he had a small magnetic tape recorder in his room, which he could easily bring up. I said fine! And rushed down to our rockoon lab to bring up my small Tektronix (Type 310) oscilloscope to look at the signal visually. I first noted the time as 0329 Z on the clock in the comm. shack. Within about 5 minutes, we were both in operation!32
Van’s detailed account described the scenario on the ship for the next several days as they continued to monitor the new satellite’s signals. Larry Cahill related his recollection of the event:
We heard about it on the radio. You know, the Navy had good radio contact with the fleet headquarters—their military directors. And also what was going on with the news. So we were informed, and everyone on the ship was. We heard the beep, beep, beep.33
As his third frustration, on 7 October, Van was laid low by a bad lymphatic infection from the gash in his leg. Even with excellent care by the ship’s doctor and another doctor, he was flat on his back in his bunk for much of the next nine days. During that time, the ship proceeded nearly 6000 miles to the neighborhood of the Line Islands.
Larry launched another of Van Allen’s rockoons for him on 13 October, when they were still nearly 1000 miles east of Christmas Island. Although that flight produced useful balloon altitude data, no higher-altitude rocket data were obtained due to either instrument or rocket failure.
As they neared the equator in the neighborhood of Christmas and Jarvis islands, the group’s emphasis shifted to Larry’s magnetometers. In that region, during the period 14 through 20 October, Larry made 10 rockoon launch attempts. Those launches ranged from about 7 degrees north to 2 degrees south geographic and geomagnetic latitude.
One of the launch attempts early in that series, made while Van Allen was still unable to assist, was marred by a rather scary incident. As Larry related it:
We started launching [magnetometer] rockoons from the helicopter deck on the stern of the
icebreaker as we approached Christmas Island, south of Hawaii. … We had filled the balloon
Special Publications 114
 with sufficient helium and were ready to release it. By that time, the ship’s direction and speed should have been adjusted to be traveling with the wind, so that there was a zero wind over the launch deck. The balloon, tethered by a line to the rocket and payload, should be straight overhead, ready for release. Unfortunately, despite our instructions, the people on the bridge hadn’t got it quite right. The line to the balloon was trailing to the stern, at an angle of 45° to the vertical. In past flights, off Greenland, Professor Van Allen had been on the bridge to counsel the Navy people on how to obtain zero wind. He was confined to his bunk for this launch, however, after gashing his shin in a fall while we were loading helium cylinders in Panama. The wound had got infected and the ship’s doctor had required him to be completely immobile. Meanwhile, I was holding the rocket and attached firing mechanism box in my arms and was providing ballast to prevent the balloon from rising. I couldn’t release the rocket since it would surely swing and hit the deck or some other part of the ship before the balloon rose high enough. Zero wind was essential so the balloon and payload could go straight up. Steve Wilson took off for the bridge and I hung on as the balloon pulled me toward the stern. As the helmsman tried to adjust course the situation got worse; the angle increased to 60°. The tug of the balloon was considerable and I moved slowly toward the edge of the flight deck. By this time, the balloon had moved to the port side of the ship, but there seemed to be little progress toward zero wind. Standing at the edge of the flight deck and leaning backward to counteract the balloon tug, I felt somewhat uneasy. As several more minutes passed with no improvement in the angle, I began to consider releasing the rocket. From where I was standing, the rocket would swing out under the balloon as the balloon rose. It would not hit any part of the ship, but would the balloon rise fast enough so it wouldn’t hit the water? After several more minutes with no improvement, I released the rocket. The rocket swung in an arc toward the water. The balloon rose sluggishly and the firing box hit the water first. Next, a wave caught the bottom of the rocket and the balloon stopped rising. Eventually the inflated bubble of the balloon sat on the water as we moved away. We conducted a thorough seminar on achieving zero wind before the next launch.34
Much later, during an informal discussion of the event, Larry related:
If we had good coordination with the ship’s people, then we had [effectively] zero wind, but that didn’t obtain very often on that ship. Often it was the case that the balloon was off in some direction, and I was holding the damn rocket, because it was tugging me toward the edge of the deck, and finally had to let it go. In one case, the balloon wasn’t high enough, and the damn rocket swung down when I released it and went in the water, so that scratched that payload. It was very irritating. We explained this to the Navy people—they were a little grouchy—they weren’t entirely happy to have us on board. They weren’t awfully interested in what we were doing, if you can believe it. …
… We certainly impressed on them that we wanted the [tethered] balloon right up over the deck, because that would make our problem much easier. If he had done that, I could have left the payload down on the deck and let the balloon lift it off, but you couldn’t. So I had to take it up, and I wasn’t too crazy to do that, because if the thing went off, it would have sliced my arms off. But I did it.35
The record of performance for Larry’s equatorial launches was mixed. The available papers make no mention of results from 4 of the 10 attempts, so it is presumed that they resulted in either poor instrument performance or rocket failure. In two other cases, the rockets fired but the data were very limited. In another case, the rocket fired at a low zenith angle, resulting in a low peak altitude and limited data.
CHAPTER 4 • THE IGY PROGRAM AT IOWA 115
The other three launches (on 17, 18, and 19 October) were fully successful. Although a greater number of successful flights would have been welcome, those three did make a major contribution toward understanding the equatorial electrojet.
After completing their work at the equator, the emphasis shifted again. Larry’s program did not call for another flight until they reached about 65 degrees south latitude, the region of the large plateau on the isomagnetic charts where they might be able to detect the effects of any polar cap current.
Van Allen was well enough by then to resume his launches. He made his next attempt on 18 October very near the equator. Although the launch produced good balloon data, no usable rocket phase data were received. During the next days, he spaced a sequence of launch attempts with his single GM counter instrument along the ship’s course at about 3 degrees, 7 degrees, 18 degrees, 39 degrees, and 40 degrees south latitude. Four of those five attempts resulted in usable balloon data, but, with mounting frustration, rocket data were not obtained from any of them.
At that point, they were approaching the southern auroral zone, and Van Allen switched to his second objective, to try to characterize the soft auroral radiation. As they passed from about 40 degrees to 70 degrees south latitude, he launched three of those instruments, of which two reached useful balloon altitude. None, however, produced usable data from the rocket phase.
It was on 30 October, just as they were approaching Antarctica, that Van Allen received the first of a series of unclear and somewhat mystifying messages on another subject. They involved the shifting of the Earth satellite instrument that I was building at Iowa from the Vanguard program to the Jupiter C launch vehicle. Because of the classified nature of the new program, those messages were intentionally convoluted, and he was not able to fully understand their intent until after he reached port in New Zealand 10 days later. He was finally able to clarify the situation during the first few days in New Zealand, and he wired his final approval for the change in the Iowa program on 13 November. The story of that exchange of messages and the decision and resulting actions are detailed in Chapter 8.
By then, the ship was off Cape Adair on the coast of Antarctica, in the Ross Sea north of the Ross Ice Shelf. It remained in that general area from 30 October to 5 November. Van Allen launched three more of his soft auroral radiation instruments there (Figure 4.6). All three produced good balloon data, and one finally yielded good rocket data. Also while there, Cahill launched eight more of his magnetometers, of which three produced good data throughout their flights.
They left the Ross Sea on 5 November, headed for New Zealand. During that passage, Van Allen made two more launches of his cosmic ray-auroral instrument, of which both produced fully useful balloon and rocket data.
 OPENING SPACE RESEARCH
|
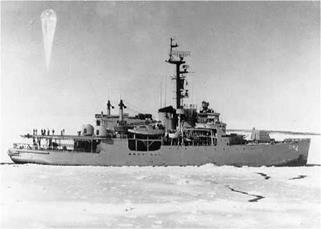
FIGURE 4.6 The icebreaker USS Glacier in the Antarctic ice pack. The balloon for a rockoon launch is inflated and about to be released. The photo was taken from an accompanying helicopter. (Courtesy of the Department of Physics and Astronomy Van Allen Collection, The University of Iowa, Iowa City, Iowa.)
|
|
The ship reached Port Lyttleton, near Christchurch, New Zealand, on 10 November. Van Allen and Cahill buttoned up their operation there and made their way home, finally arriving at Iowa City on 23 November 1957, in time for Thanksgiving.
By the time they reached New Zealand, nearly all arrangements for shifting our satellite experiment to the Jupiter C had been completed; I was poised to leave for the Jet Propulsion Laboratory (JPL) in Pasadena, California, with our cosmic ray instrument designs and prototype as soon as Van Allen gave his approval. I was already actively working with the JPL engineers to adapt it for flight on the Jupiter C launch vehicle.
Expedition results Larry Cahill’s Ph. D. dissertation contained an outstandingly lucid discussion of the entire proton free-precession magnetometer program, from the objectives to development of the instrument, description of the field program, and interpretation and publication of the results.36 The effort represents an impressive example of a highly advanced research project carried out from start to finish by a talented graduate student under the general guidance of an outstanding leader. That environment, seen in action repeatedly over those years, helped propel Van Allen’s group at the University of Iowa into such effective leadership in the early space program and thereafter.
Larry’s first successful flight in the North Polar Region verified, for the first time by direct measurement, the existence of the previously hypothesized north polar cap ionospheric current. In addition, he measured its height (centered at about 70 miles) and obtained estimates of its direction, current density, and vertical extent.
CHAPTER 4 • THE IGY PROGRAM AT IOWA 117
Even with three successful flights in the southern polar area, the corresponding current was not observed there, perhaps due to problems in interpreting the data and/or to the fact that the flights simply did not happen to be where the current was located at the particular time.
The results from Larry Cahill’s flights in the equatorial zone began to emerge in early 1958. On 7 January, Van Allen penned a note to me at JPL giving initial results from two of those equatorial flights. He wrote, “Larry Cahill has two of his equatorial flights reduced. One, near 0° latitude, shows a beautiful discontinuity of ~100y [about 100 gammas of magnetic field strength] in a 10 km. altitude range (100-110 km.) and a further discontinuity above 115 km. The other at ~3° 23" N shows a [undecipherable word] (~30y) [undecipherable word] at about the same altitude as would be expected from passing through a ‘filament’ of current.”
Larry thus confirmed the existence of the equatorial electrojet current in the lower ionosphere by the first-ever direct measurement. He determined its height and current density at several latitudes near the equator during both periods of magnetic calm and a moderate disturbance. His most exciting finding was the discovery of a second equatorial current layer slightly above the main electrojet current. That result was entirely unexpected, and although some of the theoreticians questioned it initially, its existence was eventually widely accepted.
The third result from Larry’s expedition was the measurement of the rates of decrease with altitude of the Earth’s main magnetic field at three locations. They were compared with the rate of decrease that would be seen if the Earth’s field were a simple dipole, where the inverse cube law would rigorously apply. He found that the main field in the Davis Strait falls off less rapidly than that of a dipole, while in the Antarctic, it falls off more rapidly. In the equatorial region, the field also falls off more rapidly than that of a simple dipole.
Van Allen was completely absorbed upon his return to Iowa City by the many demands on his time by the rapidly evolving space program. Much later (in 1994-1995), he returned to the original records of the 1957 expeditions to make a full reduction of the data and publish the results. In the first of those reports, he treated the entire body of data resulting from a total of 26 balloon flights ranging from 86 degrees north to 73 degrees south geomagnetic latitude. Values of the omnidirectional cosmic ray intensity were plotted as a function of geomagnetic latitude for four heights: 6.25,7.8, 9.4, and 12.5 miles. Those values represent a still-unique representation of the cosmic ray intensity at those heights during a period of maximum solar activity. He compared the values with those obtained during the Iowa expedition in 1953, a period of relative solar inactivity, and found that the cosmic ray intensity at the solar maximum was lower than its value near the solar minimum. The 1957 value was about 30 percent less than in 1953.37
OPENING SPACE RESEARCH
 He also read and evaluated the GM counter data from the 10 flights during which the combination of balloons and rockets achieved useful peak altitudes, and usable data were recovered. Those peak altitudes ranged from 48 to over 81 miles. Six of those successful flights were made in the north auroral zone (from 66 degrees to 86 degrees north geomagnetic latitude), one in the region of the equator (16 degrees north geomagnetic latitude), and three in the south auroral zone (52 degrees to 72 degrees south geomagnetic latitude). The soft auroral radiation (which by that time was being referred to regularly as auroral bremsstrahlung due to electrons interacting in the atmosphere and instruments) was detected in eight of the nine high-latitude flights. From differences in the shielding provided on the various counters, he derived values for the spectrum and energy flux of the primary auroral electrons.38
Other rockoon efforts To complete the rockoon picture, the development of a rockoon capability was undertaken in several other arenas.
Rockoons in Japan Japanese scientists announced their intent to examine the launching of rockoons at the fourth meeting of the CSAGI at Barcelona on 1015 September 1956.39 A later disclosure stated that “the Sigma project aims to develop a Rockoon, like that pioneered by J. A. Van Allen. A small rocket of about 25 lb. will be used, and a peak altitude of between 55 and 65 miles (90 and 100 km), with a payload of 5 lb, will be sought.”40 The Japanese program is mentioned again in the IGY Manual on Rockets and Satellites. That discussion includes the statement, “Preparatory experiments for the study of the balloon launching technique from a ship and from the ground, temperature change of the fuel during the balloon flight, barometric relay for the automatic firing at the altitude of 20 km, telemetry, etc. have been carried out in April, June, and July 1957.”41 An oblique mention of the Japanese rockoons is contained in a later volume of the IGY Annals. It simply states that “a total of 80 rockets and rockoons will be launched during the IGY.”42
Although preliminary tests were conducted using dummy rockets, no Sigma launchings are listed among the compilations of IGY rocket flights, and it is concluded that the operational program was never accomplished.
Australia A few references to an Australian interest in rockoon launching were found. In a discussion of their Woomera rocket launch site, it was mentioned that “Skylark, the British sounding rocket, and Rockoons are being launched at Woomera for the IGY program.”43 A slightly more illuminating allusion to a rockoon program is contained in volume 6 of the IGY Annals, with the paragraph, “In collaboration with the Upper Atmosphere Research Committee of the Australian Academy of Science, the Australian Department of Supply intends to carry out a program of high
CHAPTER 4 • THE IGY PROGRAM AT IOWA
|
TABLE 4.1 Rockoon Flight Summary
|
Period
|
Region
|
Inst.
|
Identification
|
Remarks
|
|
Aug.-Sep. 1952
|
Arctic via Davis Strait
|
SUI
|
SUI1-7
|
|
|
Jul.-Sep. 1953
|
Arctic via Davis Strait
|
SUI&NRL
|
SUI 8-23, NRL 1-6
|
|
|
Jul. 1954
|
Arctic via Davis Strait
|
SUI&NRL
|
SUI 24-37, NRL 7-12
|
|
|
Sep.-Oct. 1955
|
Arctic via Davis Strait
|
SUI & NRL
|
SUI 38-55, NRL 13-20
|
|
|
Jul. 1956
|
Pacific off San Diego
|
NRL
|
NRL 27-36
|
The numbers NRL 21-26 were apparently never assigned.
|
|
Jan.-Feb. 1957
|
Guam
|
SUI
|
|
Three rockoons were taken, but none were launched.
|
|
Aug. 1957
|
Arctic via Davis Strait
|
SUI
|
115.01 (56)-II 5.18(73)
|
|
|
Sep.-Nov. 1957
|
Atlantic, enroute to Pacific
Central Pacific
Antarctic
|
SUI
SUI
SUI
|
II 5.50F (74) – II 5.5 IF (75)
II 5.52F (76) – II 5.67F (93)
II 5.68F (94) – II 5.85F (109)
|
The numbers II 5.19-II 5.49 were apparently never assigned.
|
|
altitude research during the IGY using the ‘rockoon technique.’ A large hydrogen – filled polyethylene balloon (manufactured by the University of Bristol, England) lifts the rocket vehicle to its launching altitude of between 30,000 and 40,000 ft; the rocket, which carries 50 lb weight of instrumentation, is then fired by means of a radio link. It is expected that peak altitudes in excess of 300,000 ft will be attained.” That reference identified the project as the High Altitude Research Project (HARP) and included a picture of a HARP launch from Woomera and a tabulation of expected performance parameters.44
No HARP launchings are listed in the compilations of IGY rocket flights. Apparently, the program never progressed beyond the testing phase.
The L5 Society The Huntsville, Alabama, L5 Society (HAL5), a chapter of the National Space Society, initiated a program for launching rockoons in 1994. The project was called High Altitude Lift-Off (HALO). Its stated purpose was “to provide
OPENING SPACE RESEARCH
 cheap access to space for high school and college students, small clubs, even scientific researchers.”45
Their first launch, Sky Launch 1 (SL-1), was from Hampstead, North Carolina, on 11 May 1997. The primary payload was a video camera. The estimated peak altitude was about 44 miles. A second flight (SL-2) from a barge 60 miles southeast of New Orleans, Louisiana, was scheduled for 20 June 1998, again with a video camera. No record could be located of its actual flight or of any other later project activity.
Rockoon summary An Internet search revealed no other evidence of rockoon flights for scientific research. Evidence could not be found to indicate that other than a few test flights were made by any group other than the University of Iowa and the NRL. The use of rockoons by NRL ended in July 1956 and at Iowa in November 1957.
A tally of all known rockoon launches is shown in Table 4.1. A total of 139 rockoon launch attempts were made. One hundred and nine of those were made by the University of Iowa, and the other 30 were by the NRL.46 Of the 109 Iowa launch attempts, about 80 percent provided good data from the balloon ascent phase, and about 50 percent provided good data from both the balloon and rocket phases.
![]() enabled thousands of veterans to go to school who would not otherwise have been able to do so. By 1947, veterans made up 49 percent of U. S. college enrollment. By the end of the bill’s coverage in 1956, 7.8 million veterans attended universities, colleges, trade schools, and business and agriculture training programs.
enabled thousands of veterans to go to school who would not otherwise have been able to do so. By 1947, veterans made up 49 percent of U. S. college enrollment. By the end of the bill’s coverage in 1956, 7.8 million veterans attended universities, colleges, trade schools, and business and agriculture training programs. Study Program. That seemed to offer experience with a company that might help me decide upon a specific direction for my postgraduate work. As an added factor, both Rosalie and I wished to live closer to her family on the West Coast for a while.


 deliberations, two more Vikings remained on hand out of the original purchase and were offered for use in the Vanguard program.13
 OPENING SPACE RESEARCH



 In spite of that early failed attempt to field test his evolving instrument, Larry’s hard work did eventually pay off. He later conducted a very successful set of field rockoon operations with his magnetometer, as described later in this chapter.
 OPENING SPACE RESEARCH