Category Dreams of Other Worlds

Diagnosing Distant Worlds

The discovery of planets orbiting stars other than the Sun was one of the most dramatic events of twentieth-century science. Until 1995, our Solar System was unique. Since then an accelerating pace of discovery has confirmed more than 850 exoplanets, with 2,700 more good candidates.52 Many of these are Jupiter-mass planets, orbiting Sun-like stars within one hundred light-years.53 But exo­planet detection limits are steadily approaching Earth-mass, and systems with as many as seven planets, have been discovered. The majority of these exoplanets were discovered by an indirect method, where the orbiting planet induces a “reflex motion” or a wobble in the parent star, and the wobble is detected by a periodic Doppler shift in the spectrum of the star. Some of the early discov­eries were “hot Jupiters,” or large planets on close orbits around their parent stars. But the Doppler detection method reveals noth­ing more than a planet’s mass and orbital distance.

Spitzer, by contrast, can observe exoplanets as they pass in front of or behind their star. This is an eclipse or a transit. Only the small fraction of systems where the orbital plane is lined up with our sight line can show eclipses. The detectors can gather infrared light from large exoplanets that orbit close to their star and that are heated to at least 1000 Kelvin, if the star is within two hundred light-years of our Sun. As a planet traverses the face of its star it blocks some of the starlight. There’s a temporary dip in the infra­red signal of the combined system due to the planet blocking a portion of the stellar disk. This eclipse allows the size of the planet to be measured. Then when the planet passes behind the star (this is called a secondary eclipse), the infrared signal again dips because the planet’s contribution is missing from the system’s heat signal. The size of the drop is the amount of infrared emission coming from the planet. Spitzer’s extended orbit allows continuous obser­vations over an entire exoplanet orbit, and the telescope’s ability to measure small changes of just 0.1 percent in brightness makes these observations possible (figure 9.5).

NASA’s Kepler spacecraft, launched in March 2009, is also looking for transits caused by exoplanets by staring at a region in the Cygnus constellation. Kepler scientists want to determine whether Earth-like planets, small rocky worlds with long period orbits, are common. The exoplanet Kepler 22b, which is 2.4 times larger than Earth, was the first planet found by the telescope to orbit in the habitable zone of its sun-like star. As with the Milky Way Project that uses data from Spitzer’s GLIMPSE survey, Zooni – verse’s Planet Hunters Project invites volunteers to assist NASA in digging through Kepler’s data. Kepler sends data on more than 150,000 stars to Earth at regular intervals, and volunteers for Planet Hunters survey the stars’ light-curves to identify possible transits. “Planet Hunters is an online experiment that taps into the power of human pattern recognition,” organizers explain on the

Diagnosing Distant Worlds

Figure 9.5. A distant exoplanet is partially eclipsed by its parent star in this art­ist’s impression. Spitzer uses observations like this to “taste” the atmosphere of an exoplanet by seeing which atoms or molecules are absorbed by the atmo­sphere. This particular planet is about 1000°F and the atmosphere has substan­tial amounts of carbon monoxide but surprisingly little methane (NASA/SSC/ Joseph Harrington).

website. So far, two likely planets have been detected by citizen sci­entists in the Kepler data.54 As has been the history of science from its earliest days, nonspecialists are making serious contributions to Kepler’s scientific outcomes.

While Kepler can predict statistically the ubiquity of planets in our galaxy, it takes the sensitive instruments of an infrared tele­scope to characterize their composition. Spitzer’s ability to di­agnose the atmospheric composition of remote exoplanets was a big surprise. Observations have been made on more than two dozen exoplanets, with dozens more expected during the ongoing “warm” mission. Spitzer project scientist Michael Werner explains the telescope’s contribution to this effort: “Because hot Jupiters are rich in gas, different wavelengths arise from different levels in the atmosphere of different chemical constituents. Spitzer data have allowed the determination of planetary temperatures and of con­straints on chemical composition (including the identification of water vapor), atmospheric structure and atmospheric dynamics.”55 Though Spitzer’s primary mission was to detect objects hidden by interstellar dust, characterizing exoplanets may become its greatest contribution.

In 2007, scientists first measured weather on a planet beyond the Solar System.56 The planet HD 189733b races around its par­ent star in just over two days. Temperatures across the planet range from 970 K to 1220 K, which means winds of 6,000 mph must rage to keep the temperature variation that modest. By compari­son, the Earth’s jet stream sails along at only 200 mph. The exo­planet Upsilon Andromeda b is even more extreme; day to night temperature variations are 1400°C, that’s 2550°F, and a hundred times larger than is typical on Earth!57 In the young, dynamic field of exoplanets, there have been many surprises, and theorists’ ex­pectations are often confounded. One hot Jupiter-like planet was found to have carbon monoxide but almost no methane. This vio­lates models of hot gas giants, where most of the carbon should be in the form of methane. Another two planets are shrouded by dry, dusty clouds unlike anything seen in our Solar System. These planets show little of the expected water or steam, meaning that, if present, water might be hidden under the clouds in the form of a scalding ocean.

The Peoples Telescope

The Hubble Space Telescope has contributed to the identification of exoplanets, the dark energy that permeates the universe, and massive black holes that lurk in nearby galaxies. Probably no other science facility has left its mark in so many homes or done more to advance the general public’s understanding of the structure, age, and size of the universe. Breathtaking photographs of regions of star formation, stunning spiral galaxies, exploding planetary neb­ula, and the most distant galaxies in the visible universe spill out of coffee table books, adorn the walls of children’s bedrooms, and serve as computer screensavers. Why is that? The answer is not simply that the Hubble images pervade popular culture, though of course they do. There are multiple factors that might account for the telescope’s tremendous popularity and an increasing public awareness of, and affection for, the telescope.

While there are telescopes with twenty-five times the light­gathering power on Earth, Hubble remains the premier tool of astronomers due to its exquisite sensitivity, and the ubiquity of the Hubble photographs has been unprecedented. From newspa­pers and magazine covers, to planetarium and museum programs and displays, popular science books, posters, calendars, and post­age stamps, Hubble images pervade popular culture. Moreover, the emergence of the Internet has afforded global access to the telescope’s photos and scientific results. In July 1994, when Comet Shoemaker-Levy 9 slammed into Jupiter with an estimated ex­plosive force of six hundred times humanity’s entire nuclear ar­senal, Hubble offered up-close views of the devastating planetary impacts. Astronomer David Levy, co-discoverer of the comet, re­ported that millions of people around the world watched on televi­sion or via the Internet as the comet’s line of fragments bombarded the massive planet.20

Art historian Elizabeth Kessler offers several less obvious rea­sons why the Hubble Space Telescope is so cherished worldwide. She contends that Hubble’s spectacular images have become “in­terwoven into our larger visual culture” in part because of their very deliberate construction along the lines of sublime art, which often seeks to evoke grandeur, great height and breadth of field, and an overwhelming awe of the power of nature (plate 19). She points out that many of the Hubble images released by the Space Telescope Science Institute (STScI) and the associated Hubble Her­itage Project reflect the aesthetics of nineteenth-century paintings of the American West. “Light streams from above” in the Hubble images as in landscape paintings, explains Kessler,21 despite the fact that there is no up or down in space. Through such fram­ing strategies Hubble’s photos are often configured like landscape paintings or photographs.

Kessler argues that what also endears Hubble to so many is that its photos provide a means for public audiences “to imagine the possibility of seeing such spacescapes with our own eyes.”22 But Kessler is careful to clarify that all published Hubble photos are interpretations, usually composites of multiple images captured at various wavelengths of light. Even if we could travel at many times the speed of light across the galaxy to observe astrophysical ob­jects, because of the rods and cones in the human eye, we would likely be unable to see color in faint light sources. The reason is that the cones in the human eye allow us to see color, but cones need lots of light to do so. The rods require less light, but do not pick up color. That’s why photographs of the Milky Way arced across the night sky often include color that we cannot see with the naked eye.23

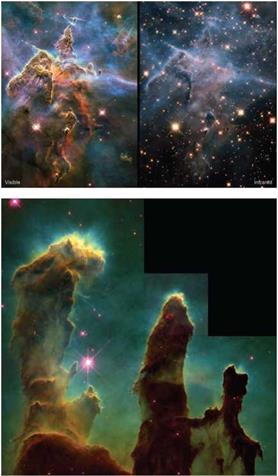
Kessler points out that the Hubble Heritage images are exten­sively processed and represent not what the human eye would see, “but a careful series of steps that translate numeric data into pic – ture.”24 Hubble collects data in visible light but also supports a suite of instruments that “see” at wavelengths not visible to the human eye, such as infrared and ultraviolet light that can reveal additional details. In actuality, HST’s electronic detectors see only intensity, which can be represented in grayscale, a range of shades of black and white, or gray. A set of filters made of colored glass, such as red, green and blue, are rotated in front of the detector as images are captured.25 With spectroscopy, different wavelengths of light are dispersed with a grating and linearly arrayed on the detector. Once the data have been collected, color is added in pro­cessing by combining the images using different filters with the appropriate weights to reproduce “true color”26 that can be used to distinguish gases within a nebula or their temperatures, or to distinguish young, hot, newly formed stars from older, cooler stars.

Space Music

While astronomers were tuning their high-fidelity radio antennas to outer space, electronic artists began turning electromagnetic ra­diation into music.33 Penzias and Wilson accidentally discovered the cosmic microwave background in 1965 just as high-fidelity equipment necessary for radio astronomy, as well as synthesizers and electronic instruments suitable for rock music, were being de­veloped. Both fields were poised for an unprecedented exploration of the cosmos.

Bell Laboratories was the perfect place for this seemingly unre­lated exploration of outer space. Having produced the first high – fidelity phonograph recording in 1925, Bell Labs advanced the technology used in radio astronomy and in generating electronic music. Karl Jansky, while investigating at Bell Labs the reasons for static in long-distance shortwave communications, in 1931 laid the foundations for radio astronomy by detecting naturally occur­ring radio sources at the center of the Milky Way. A quarter of a century later, Max Mathews, also at Bell Labs, began using a com­puter to synthesize sounds. Often credited as the father of com­puter music, Mathews wrote the code for the computer program Music 1, which in later iterations became a widely used program­ming language for computer-generated music.34 The lab’s simulta­neous interest in radio technologies and electronic music is hardly surprising, since from its founding by Alexander Graham Bell, the company that became Bell Labs was dedicated to developing elec­tronic media such as the phonograph, telephone, radio, and other communication technologies.

Music historian Pietro Scaruffi contends that it was not the elec­tric guitar, as one might expect, that would “revolutionize rock music down to the deepest fiber of its nature,” but the emergence of electronic synthesizers and computer programs designed for musi­cal composition. By 1966, Robert Moog had developed the syn­thesizer, “the first instrument that could play more than one ‘voice’ and even imitate the voices of all the other instruments.”35 Within four years, Moog was marketing the Minimoog, a portable ver­sion that allowed for live performance with the synthesizer. And in the decade that followed, high fidelity or hi-fi technology emerged as turntables, synthesizers, oscillators, and other electronic devices became more widely used precision instruments.

Even as Penzias and Wilson at Bell Laboratories were measuring the exact temperature of the cosmic microwave background, avant- garde electronic artists like the German group Tangerine Dream began exploring the new music genres made possible by electronic instruments, keyboards, and synthesizers. The group is credited with launching what was referred to as kosmische musik, cosmic or space music that later evolved into disco, ambient, techno, trance, and other new age genres.36 Their album Alpha Centauri (1971) is purportedly the first electronic rock space album in history. Scar – uffi writes, “Tangerine Dream’s music is the perfect soundtrack for the mythology of the space age. . . . They were contemporaries with the moon landing. The world was caught in a collective dream of the infinite. Tangerine Dream gave that dream a sound.”37 In 1972, they produced the album Zeit (Time) that included among other tracks “Birth of Liquid Plejades” and “Nebulous Dawn.” Other space-themed selections by the group were titled “Sunrise in the Third System,” “Astral Voyager,” and “Abyss.” Edgar Froese, one of the group’s founding musicians, wrote “NGC 891” for his solo album Aqua (1974) in reference to the crisp, nearly edge-on gal­axy in Andromeda oriented so that its dust lanes sharply highlight the galaxy’s outer spiral arms. English astronomer James Jeans in­cluded an image of NGC 891 in his popular astronomy books of the 1930s, and astronomers repeatedly cited this seemingly perfect spiral galaxy to illustrate what the Milky Way would look like from 30 million light-years away.38

In 1920, Leon Theremin invented an electronic instrument that produced electronic sound by moving one’s hands near two anten­nas that controlled pitch and volume. The theremin’s eerie tones often were used to generate sequences meant to evoke space-like themes, and the instrument served as a mainstay in both avant – garde and rock, particularly in the Beach Boys’ selection “Good Vibrations.” Such electronic instruments, along with synthesizers, modulators, and amplifiers, became invaluable to sound designers working in the film industry. Ben Burtt, for instance, widely known for the “synthesized sound worlds” of the Star Wars films, actually developed the now easily recognized laser-gun sounds by record­ing and manipulating the twang of a guy-wire from a radio tower after accidentally getting his backpack hooked on one.39

Just as the first generation of astronauts was walking in space and on the lunar surface, the related genre of “space rock” was likewise exploring the cosmos. The genre emerged as an art form during the late 1960s via the British psychedelic movement. The title track to David Bowie’s album Space Oddity (1969), which opened with the memorable phrase “Ground Control to Major Tom,” shaped much of space rock to come. Pink Floyd’s The Dark Side of the Moon (1973), with its closing track “Eclipse,” is one of the best-selling rock albums in history. American songwriter Gary Wright’s “Dream Weaver” (1975) was composed using only keyboards, synthesizers, and drums and according to Wright was intended as a kind of fantastical train ride through the cosmos. Innovators like Brian Eno and Steve Roach contributed to spaced – themed ambient music in their evocative soundscapes. Eno’s Apollo: Atmospheres & Soundtracks (1983), the soundtrack for Al Reinert’s space documentary For all Mankind, was intended to capture “the grandeur and strangeness” of the Apollo mis­sions. Eno characterizes the soundtrack as evoking the astronauts’ somewhat disorienting experience of “looking back to a little blue planet drifting alone in space, looking out into the endless dark­ness beyond, and finally stepping onto another planet.” He adds that the score was an attempt to extend “the vocabulary of human feeling just as those missions had expanded the boundaries of our universe.”40

But the intersection of music and cosmogony goes back to pre­history, when nomadic people would literally “sing the place” to recreate and remember a physical landscape in the form of song. Songlines in Australia provide the Aborigines with unerring navi­gation over harsh terrain that can extend for thousands of miles.41 Language may have started as song and the aboriginal Dreamtime sings the world into existence. Bringing the concept into the digital age, eclectic singer-songwriter Bjork released an album in 2011 titled Biophilia, where each track is a sensory experience rooted in sound but extending into an iPhone app.42 With songs ranging from “Cosmogony” to “Dark Matter,” Bjork explores inner and outer space with her ethereal, electronic, sonic environments.

On Planets and Dwarfs

Somewhere in the twilight between stars and planets lie objects called brown dwarfs. Below about 8 percent of the Sun’s mass, physical conditions will never allow the fusion of hydrogen into helium, as happens in the Sun. There may be a flickering of en­ergy from the fusion of hydrogen into deuterium, but lower mass objects don’t have a sustainable source of energy. When they’re young, brown dwarfs are easy to observe in the infrared because they generate a lot of heat during their gravitational collapse. As they age, they get cooler and fainter. For example, a puny star 10 percent of the mass of the Sun would have a temperature of 3000 K and a luminosity 1/10,000 that of the Sun. By contrast, a brown dwarf 5 percent of the mass of the Sun would be three times cooler and a further 100 times dimmer. It would take a million of these feeble objects to equal the light of the Sun. Some astronomers con­sider Jupiter a failed star or a brown dwarf. Models indicate that brown dwarfs likely host moons like those of Jupiter and Saturn, worlds replete with weather systems, geysers, volcanoes, moun­tain ranges, and oceans—even if, as on Europa, the oceans are frozen over.

Set on a moon orbiting a gas giant planet in the nearby Alpha Centauri star system, James Cameron’s film Avatar (2009) mes­merized audiences with its rendering of Pandora orbiting a Jupiter- like world whose swirled and rippled clouds resemble those of Ju­piter and its Great Red Spot. Cameron’s Pandora (one of Saturn’s moons also happens to be named Pandora) abounds in colorful flora and fauna evocative of Earth’s ocean environments, like the giant Christmas Tree Worms that suddenly retract when touched, the seeds of the sacred tree that float with the pulses of a jelly­fish, and the photophores that dot the plants, animals, insects, and human-like inhabitants of Cameron’s adventure tale.58 That the Na’vi have blue skin seems no accident or random artistic choice. In ocean waters, blue light is least absorbed and can penetrate into the depths so that most deep-sea animals see solely in blue light. With the announcement in October 2012 of an exoplanet with a similar mass to Earth detected in the Alpha Centauri triple star system, Cameron’s fictional depiction seems even more plausible.59

In part, what captivated film audiences was the bioluminescence with which Cameron painted his Pandoran forests. Having ex­plored and documented deep ocean fauna in the film Aliens of the Deep (2005), Cameron is familiar with myriad bioluminescent sea life and readily projects similar plants and animals onto his imagi­nary world. Draped with waterfalls alight with bioluminescence, Pandora’s forests teem with glowing fireflies and whirling fan liz­ards. The forest floor is carpeted with illuminating moss, while its streambeds are lit with the equivalent of sea anemones. In effect,

Cameron anticipates how life might be adapted on an exomoon of a gas giant planet or a brown dwarf star. On such worlds, we might expect to find luminous biota highlighted with photophores as Cameron predicts or species with eyes better adapted to night or low-light conditions. Even as felines have dark-adapted vision superior to humans, the Na’vi have feline features and navigate the night-t ime forest with far better facility than the character Jake. Cameron’s bioluminescent world may have been inspired by Jules Verne’s 20,000 Leagues Under the Sea, in which the char­acters, strolling on the ocean floor, encounter bioluminescent jel­lyfish and note their “phosphorescent glimmers.” Actually, nearly all jellies in the deep sea are luminescent. Verne’s voyagers likewise chance upon corals, the tips of which glow. In stark contrast to the nineteenth-century perception that the ocean floor was devoid of life, Verne imagined the seafloor abounding in bioluminescence. An engraved illustration for 20,000 Leagues titled “On the ocean floor” depicts a kelp forest with large corals, crustaceans, and a flotilla of giant jellyfish whose bodies and tentacles radiate light (figure 9.6). Cameron’s vision of bioluminescent organisms flour­ishing on a nearby exomoon is similarly prescient.

Back on Earth, the first brown dwarf was discovered in 1995. Spitzer has contributed to this research by detecting some of the coolest and faintest examples known, including eighteen in one small region of sky sifted from among a million sources detected.60 Despite their extreme faintness, Spitzer can detect the coolest brown dwarfs out to a distance of one hundred light-years. The outer layers of these substellar objects are cool enough that they’re rich in molecules. The composition of the gas, and so the appear­ance of narrow lines that act as chemical “fingerprints” in the spec­trum, changes as the brown dwarf evolves. Most of the eight hun­dred cataloged brown dwarfs have atmospheres with temperatures in the range 1200°C to 2000°C. The next category, with tempera­tures from 1200°C down to 250°C, has strong methane absorp­tion in their atmospheres. There’s overlap (and often confusion) between planets and brown dwarfs because some giant exoplanets are larger and hotter than some brown dwarfs. The very coolest category of the brown dwarf, and the end point of their evolution, has recently been discovered. NASA’s Wide Field Infrared Survey

On Planets and Dwarfs

Figure 9.6. An original illustration from Jules Verne’s 20,000 Leagues Under the Sea depicting bioluminescence. A more modern media representation is in James Cameron’s 2009 motion picture Avatar, where bioluminescent creatures inhabit the exomoon Pandora, where the action takes place. On Earth, thousands of species of sea creatures of all sizes employ bioluminescence (Jules Verne’s 20,000 Leagues Under the Sea).

Explorer (WISE), which was launched in 2009, has finished a scan of the entire sky at infrared wavelengths. In 2011, astronomers reported six of the coolest stars ever found, one of which has a sur­face at no more than room temperature.61 The WISE data have the potential to reveal brown dwarfs closer than Proxima Centauri, the nearest star to our Sun.

Another promising mission in the search for dwarf stars and transiting exoplanets is headed by Harvard astronomer David Charbonneau and was designed largely by Philip Nutzman, an as­tronomer at the University of California, Santa Cruz. The MEarth Project is focusing eight small robotic telescopes on 2,000 M dwarf stars.62 The project targets particularly M dwarfs as they are smaller than the Sun and transiting planets would block out a greater portion of the star’s light, making them easier to detect. Studying nearby transiting exoplanets could afford astronomers a better sense of whether Earth-like planets are common and ad­ditionally allow astronomers to discriminate the chemistry of their atmospheres. Within six months of launching their project, the team detected their first transiting planet, a super-Earth named GJ 1214b in orbit around a star 13 parsecs from Earth.63 In 2010, the journal Nature reported that the atmosphere of GJ 1214b was found to be comprised either of water vapor, or of thick clouds or haze as on Saturn’s moon Titan.64 Infrared investigations are planned to determine which of these options exist on the planet. With resources like Zooniverse. org, in the coming decade the pub­lic will likely contribute to the search for biomarkers such as ozone or water vapor in the atmospheres of these other worlds.

Awash as it is in newborn stars and exoplanets, the universe may be teaming with life. Perhaps in some far future humans will have physical, robotic, or other means of virtual presence on a nearby exoplanet or one of its moons that, similar to Cameron’s Pandora, teems with bioluminescent life. Astronomer Carole Haswell cau­tions, “If any of this is to happen, however, we need to use our collective ingenuity to understand and repair the effects that our industrial activity and our burgeoning population are having on our own planet.”65 What we learn from exoplanets, Haswell sug­gests, might be invaluable in understanding Earth’s climate evolu­tion and in ensuring our own survival and that of our companion species. In the meantime, NASA and the astronomical community welcome the public’s contribution to one of humankind’s greatest adventures—locating possible habitable planets and, in time, the signatures of life in some dark and overlooked corner of the vast and silent wastes of interstellar space.

On Planets and Dwarfs

The Science in Hubbles Iconic Pictures

Kessler explains that some astronomers were initially dismissive of Hubble’s “pretty pictures.” They felt such images had less to do with science and that the public would accept the false color pho­tos as what Hubble actually sees. But as Kessler points out, Hubble was the vehicle for changing this perception, particularly in the case of the stunning images of the Eagle Nebula (M16) released in 1995 (plate 20). A group of astronomers at Arizona State Uni­versity led by Jeff Hester were interested in photo-evaporation, by which they suggested radiation from a massive star in the nebula is evaporating gaseous material away from sites of newly forming stars. Kessler notes that Hester’s team “did not plan the observa­tion with the intention of creating a visually impressive picture.”27 However, their remarkable image of the Eagle Nebula awed scien­tists and general audiences alike. And, as anticipated, in the nebu­la’s 10-trillion-kilometer gaseous columns, Hester’s team identified regions of newly forming stars.

Upon release of the Eagle Nebula images, Kessler reports, “The New York Times, Washington Post, USA Today, and other major newspapers printed articles featuring the image, and Newsweek, U. S. News and World Report, and Time all ran stories in the fol­lowing weeks.”28 Kessler highlights the fact that while the news reports detailed Hester’s theory regarding new star formation, the real emphasis of the news coverage was the spectacular beauty of the cloud pillars in the Eagle Nebula, subsequently dubbed the “Pillars of Creation.” A report in 1999 on Hubble’s popularity by the Space Telescope Science Institute indicates that “web hits at the time of the M16 release were about a half a million a month.”29 The fascination with Hester’s image of the Eagle Nebula demonstrated that stunning astronomical photos could capture both important scientific data and amazing spacescapes that readily communicate complex information to general audiences. Kessler points out that NASA quickly realized the tremendous public support for Hubble might be better served through an organization that would regu­larly request, produce, and release images taken by Hubble. The Hubble Heritage Project emerged out of such interest.

Commenting on what he and members of the Hubble Heritage Project were looking for in the composition of spectacular photos like that of the Eagle Nebula, Jeff Hester explains:

I want [people] to realize, when they look at images like that, that what they are looking at is humans acting on this urge within us. Going out there and proactively building the technology and the tools that allow us to reach out with our minds and our aesthetic and our imagina­tions and our sense of wonder and our sense of curiosity. . . . That these [photographs] are not just nicely aesthetic, but. . . testaments to what we as people are able to do. To take images of columns of clouds of gas and dust several thousand light years away in which stars are forming, and to bring them home and to make that part of the universe known to us, to extend the sphere of the human mind and imagination out to encompass those things.30

Hester nevertheless understands the difficulty in communicating complex scientific information:

[Science] demands a rigorous vocabulary, the vocabulary of math­ematics. It demands that you learn to think in that vocabulary. That’s not a vocabulary that’s accessible to a lot of people. . . . [I]t really mat­ters that you find a way to get around the vocabulary problem, that you find a way to bother to think about who it is that you’re talking to, what is it that they are familiar with . . . [so] that instead they can start to get their arms around [it] a little bit.31

The Hubble Heritage Project’s home page provides thumbnails of approximately two hundred images; these are the best of the best from among tens of thousands of images taken by the facility.32 Ac­cording to Kessler, the project was the brainchild of planetary sci­entist Keith Noll and astronomer Howard Bond. Along with Anne Kinney and Carol Christian, these scientists collaborated to create Hubble Heritage images to promote public education and general interest in astronomy and space science. Kessler contends that they have expertly achieved these goals by blurring the boundaries be­tween art and science to contribute to both astronomical investi­gation as well as popular understanding of cosmology. Keith Noll summarizes the project’s objective:

“[M]y real hope for this is that there are kids that have our pictures on their walls, that maybe spend some time dreaming about what it’s like to be in space, what it would be like to travel to these exotic places. . . . But what I really hope is that they all sort of carry this little bit of awe and mystery with them in their lives, so that everything isn’t just about getting up and driving in traffic and paying bills. It kind of helps to remember. . . how amazing the universe is.33

Hubble’s photos easily convey some of the most fascinating as­pects of star birth and death, and solar system formation. In many cases it doesn’t require specialized or scientific training to immedi­ately grasp the import of some of Hubble’s most remarkable im­ages. This is true for the Hubble photos of the Eagle Nebula and its collapsing gases in star birth regions, the newly forming star systems in the Orion Nebula (M42) with its proto-planetary disks the size of our Solar System, the star birth visible in the arms of the Whirlpool galaxy as illustrated in the mosaic of M51 (figure 11.2), or the bizarre and complex cloud formations produced by dying stars at the heart of planetary nebulae.

Perhaps the simplest reason for the Hubble telescope being so cherished is that in a single bound, complex scientific investigation can be conveyed in a handful of amazing images. The tremendous energy radiated as stars blow off their gaseous outer layers is evi­dent at a glance from a single image. While the average person may not have imagined the import of a star’s magnetic field in shaping planetary nebulae, the effects of intense radiation and stellar winds are nearly palpable in such photographs. In images with less obvi­ous information, a simple caption can make the meaning immedi­ately comprehensible to the nonspecialist. A short caption regard­ing the pillars of dust in the Eagle Nebula towering to 10 trillion

The Science in Hubbles Iconic Pictures

Figure 11.2. M51 is a nearby spiral galaxy called the Whirlpool galaxy; this is how the disk of the Milky Way would appear if we could gaze down on it, rather than being embedded in the disk. A nearby companion galaxy is triggering intense star formation in the spiral arms. Hubble Space Telescope can resolve individual bright stars in this galaxy (NASA/STScI/Hubble Heritage Team).

The Science in Hubbles Iconic Pictures

Figure 11.3. The Red Spider Nebula (NGC 6537) has waves of dust and gas extending a hundred billion kilometers. First cataloged by William Herschel over two hundred years ago, the subtle patterns are due to shock waves caused as outflowing material runs into the interstellar medium, a gas more sparse than the best vacuum on Earth (NASA/ESA/STScl/G. Mellema).

kilometers, or 6 trillion miles, or explaining that stellar winds in the Red Spider Nebula (NGC 6537) produce waves of dust and gas a hundred billion kilometers high (figure 11.3), while nearly incom­prehensible, has afforded general audiences unprecedented under­standing of the incredible energy and matter involved in star birth and death.34 Hubble images of gravitational lensing caused by large clusters of galaxies, majestic barred spirals whirling through space, and spectacular globular clusters have been indelibly etched into the public imagination. But beyond this popular appeal, the Hubble Space Telescope has generated enough unique data to qualify as the most successful scientific experiment in history.

Celestial Harmonies

The correlation between music and exploration of outer space is deeply rooted in the human psyche. The Greek mathematician Pythagoras was purportedly the first to show that musical notes, octaves, chords, and their harmonics were the product of simple mathematical ratios and whole numbers. The Pythagoreans real­ized that a string attached to an instrument produces a fundamen­tal tone when plucked. Halve the string and the tone will be an octave higher. Other harmonics, or overtones, occur at the third, fourth, fifth, seventh, and ninth divisions or intervals of the string. The Pythagoreans further posited that the universe itself could be understood in terms of this basic mathematics of music, and that the planets, for instance, would be distanced from the Sun in inter­vals similar to the intervals along a string that produce harmon – ics.43 By the early 1600s, German astronomer Johannes Kepler was also captivated by Pythagoras’s notion of a “music of the spheres.” He theorized in Harmonices Munde (The Harmony of the World) that musical harmonies could be seen in the motion of planetary bodies. As physicist Amedeo Balbi explains, “Building on ideas by Pythagoras and Plato. . . Kepler was trying to give a scientific foundation to the concept of the ‘music of the spheres’, the idea according to which each planet moving around the Sun produces a definite sound.”44 Kepler suggested their orbits would be deter­mined by the mathematics of musical harmonics.

Stars, galaxies, even planets naturally produce electromagnetic energy, or low-energy radio emission, as they rotate and move through space. Several planets in our Solar System generate strong electromagnetic emissions from their powerful magnetospheres. In the 1970s, the Voyager spacecraft recorded Jupiter’s radio emis­sions. Of course, the human ear cannot detect sound in the empty vacuum of space. However, we can “hear” the whine of Earth and the eerie sounds of Saturn’s radio emissions via satellite recordings translated by computer programs that render measured frequen­cies as audible sound.45

Far more impressive are the acoustic tones of the Sun, as we learned in the chapter on SOHO. Astrophysicists are learning a great deal about the interior composition and physics of the Sun via helioseismology, by which astronomers track acoustic sound waves that travel through the entire body of the Sun. Amazingly, the Sun resonates with myriad sound waves that can be measured like musical notes that are directly analogous to fundamental tones and complex harmonic overtones. Turbulence at the top of the Sun’s convective zone segments the photosphere into granules, thousands of kilometers across, that pulse up and down. These pulses send sound waves careening through the body of the Sun and reveal a characteristic acoustic imprint at various internal boundaries like that between the convective and radiative zones.46 By recording the acoustic waves traveling through our Sun, astro­physicists have a far better understanding of the internal struc­ture of stars, the abundance of helium in our Sun revealing its age, the Sun’s rate of rotation, and how temperatures at the core compare to its million-degree corona. These internal acoustic waves also are associated with storms on the solar surface and are being used to predict future sunspots by detecting disturbances inside the Sun.47

Synesthesia is the experience of one sense being rendered as an­other so that you can taste a color or hear visual phenomena. Just as musicians were experimenting with electronic and psychedelic explorations of outer space, astronomers were documenting the Sun’s acoustic waves and experiencing their own synesthesia. In the case of the tonal resonances generated by the Sun’s pulsing surface, scientists can hear what they visually detect of this reso­nance. The first phase of helioseismology, launched from 1960 to 1979, interestingly emerged during the same period as the rise of electronic space music.

EXPLORING THE VIOLENT COSMOS

When we dream of other worlds, our dreams may be vivid and real and colorful, but they’re subject to the limitations of our senses. To visualize something, even if in our mind’s eye, we use the visual sense. For most of the history of astronomy we learned about the universe exclusively through visible light. Tens of thousands of years of naked-eye observations were followed by the first night time use of the telescope by Galileo in 1610, followed by a steady march of successively larger telescopes, culminating with the 8-11 meter behemoths of the present day, with dreams of even larger ones to come.1

The historical focus on visible light was natural, since the most powerful human sense evolved to match the peak energy output of our life-giving star. The cool outer envelopes of stars emit most of their radiation in the visible range, and galaxies are just assem­blages of stars. The night sky is visually rich. About 6,000 stars are visible to the naked eye at a dark site, but they are just an infini­tesimal sliver of the stellar plentitude of the universe. We live in a system of 400 billion stars, and the observable universe contains roughly 100 billion stellar systems, for a staggering total of 1023 stars.2 Also, the spectral transitions that are the fingerprints of dif­ferent types of atoms fall mostly in the visible wavelength range. Cosmic chemistry is practiced with telescopes that gather light and disperse it into its constituent wavelengths.

Nevertheless, just over two hundred years ago experiments showed there are wavelengths longer than the reddest waves of light and bluer than the bluest waves of light. A hundred years later, Wilhelm Rontgen performed the first systematic experiments to understand the nature of mysterious radiation that was gener­ated by high-energy particles moving in the vacuum of a sealed glass tube. In 1895, he announced the discovery of “X rays.” The details of the discovery are poorly documented because Rontgen had his lab notebooks burned when he died. X-rays electrified the scientific community and within a year their potential for medical imaging was realized. It was a lot longer before anyone discovered that they could be used for astronomy. Rontgen received the first Nobel Prize ever awarded for Physics in 1901.3

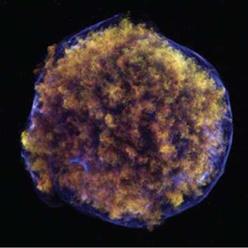
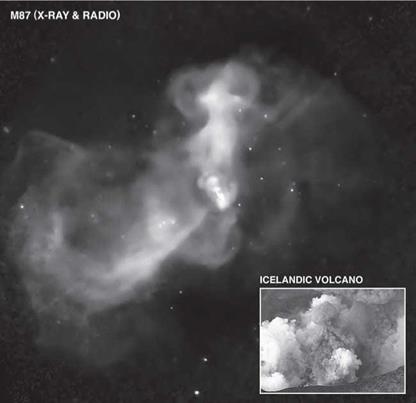
Just as X-rays provided a window into the human body, they now provide a window in space onto worlds barely imagined. X – ray telescopes have revealed the nature of black holes and neutron stars for the first time, they’ve discovered sizzling hot plasma in the centers of galaxy clusters and in the diffuse space between galax­ies, and they’ve let us make great strides in probing extraordinary black holes that lurk in the centers of all galaxies, ranging from a few million up to a few billion times the mass of the Sun. Their high energy relative to visible light means they’re often created by events of unimaginable violence, phenomena unknown to us fifty years ago (figure 10.1).

The Cosmic Distance Scale

What is the science yield from this premier facility, and how has it changed our view of the universe? In the early years of a space telescope, there’s often a concerted effort to put a lot of time into a few critical projects, so that major results will be obtained even if the telescope fails. There’s understandable tension involved in this decision, since the Hubble has always been oversubscribed by a large factor, and it keeps more astronomers happy if the time is thinly spread among many projects. Riccardo Giacconi, the first director of the Space Telescope Science Institute, was persuaded to set aside substantial time for peer-reviewed “Key Projects.” Early in the history of the facility, three of these were approved. Two of them were successful but are not well known—a medium – deep survey of galaxies,35 and a spectroscopic survey of quasars to probe the hot and diffuse gas in the intergalactic medium36—but the third is rightly considered one of the Hubble Space Telescope’s finest achievements.

As we saw in the chapter on Hipparcos, distance is fundamental to astronomy, yet it’s one of the hardest things to measure. In the everyday world we judge distance based on familiarity with the size of a tree or a person, for example, or the brightness of a lamp or a street light. But in the universe, objects like stars and galax­ies range over many orders of magnitude in size and brightness, so their apparent size or brightness is a very unreliable guide to distance. Is that a bright object far away or a dim object nearby? Is that a large object far away or a small object close by? This type of confusion is common. Considered in a different way, poorly deter­mined distances limit our knowledge of how the universe works. Without knowing how far away an object is, we don’t know its true size or its true brightness. That also means we don’t know its mass or luminosity, which means we can’t have a real physical un­derstanding of something that’s so remote that we’ll never be able to study it in the lab or gather a sample of it. This urge to measure distances accurately becomes acute in the study of the universe as one entity. In an expanding universe, precise distances are needed to answer fundamental questions: what is the size of the universe and how old is it?

Early in the life of the Hubble telescope, hundreds of orbits were devoted to measuring distances to three dozen galaxies. Fittingly, this Key Project used the method that Edwin Hubble had used in the early 1920s to show that the Andromeda nebula was a remote stellar system. Hubble identified examples of a well-known class of variable stars in M31, the Cepheid variables. Cepheids pulsate in a well-understood and well-regulated way, and this behavior mani­fests as a linear relationship between their luminosity and their period of variation.37 By finding Cepheids in a remote galaxy and measuring their periods with a series of images taken over hun­dreds of days, the star’s absolute and apparent brightness can be combined to derive the distance. Cepheids are very luminous and can be seen to large distances. But they’re buried in dense regions of overlapping star images so the sharp imaging of a telescope in space is needed to pick them out. Wendy Freedman, Rob Ken – nicutt, and Jeremy Mould led the project, accompanied by twenty – five other astronomers from around the world.

The Key Project had a goal of measuring the distance scale to an accuracy of 10 percent. This might seem unduly modest, but it’s a reflection of the difficulty of the experiment. In the decade leading up to the launch of Hubble, astronomers had disagreed by 50 percent or more on the distance scale. In particular, the goal was to measure a quantity called the Hubble constant to within 10 percent. The Hubble constant is the current expansion rate of the universe, measured in units of kilometers per second per Megapar­sec. Hubble discovered a linear relation between the distance and the recession velocity of a galaxy. The Hubble constant sets that scaling. So if the Hubble constant is 70, then for every Megaparsec (3.3 million light-years) increase in distance, the recession velocity increases by 70 kilometers per second (157,000 mph). On average, this scaling says that a galaxy a million light-years away is reced­ing from the Milky Way at 47,000 mph, a galaxy 10 million light – years away is receding at 470,000 mph, and so on. Inverting the Hubble constant allows us to project the expansion back to zero separation of all galaxies, and so gives us a good estimate of the age of the universe. By measuring distances out to 20 Megaparsecs (or 66 million light-years), the Key Project would determine the size, expansion rate, and age of the universe.

The formal result of the Key Project was the measurement of a current expansion rate of 73 kilometers per second per Megapar­sec, with a random error of 6 and a systematic error of 8, published in the twenty-eighth paper in the series from team members, which indicates just how productive and prolific one Hubble project can be.38 Synching the distance scale in this way has been a foundation stone in the emergence of “precision cosmology,” where overall attributes of the universe are becoming very well-determined. Al­though the Key Project worked in our cosmic “back yard,” or the local 0.01 percent of the visible universe, it leveraged and helped to improve distance measurements both inward and outward. Hub­ble also was able to measure parallaxes for Cepheids in the Milky Way (along with Hipparcos, which we’ve previously discussed) and tether the distance scale in direct geometric measures. Know­ing Cepheid distances for several dozen galaxies calibrated the use of other types of distance indicators, such as supernovae and the well-defined rotation properties of galaxies, which can be used out into the remote universe.

Grooves in the Cosmic Pond

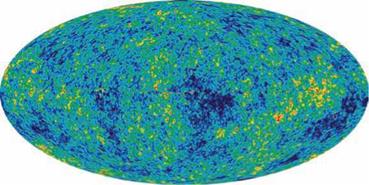
As early as 1937, James Jeans observed that “the tendency of mod­ern physics is to resolve the whole material universe into waves, and nothing but waves. These waves are of two kinds: bottled-up waves, which we call matter, and unbottled waves, which we call radiation or light.”48 WMAP’s image of the early universe would seem to confirm Jeans’s observation that the universe might be un­derstood in terms of waves. Even as sound waves traveling through the Sun’s plasma reveal information about its structural composi­tion, fluctuations in the plasma that comprised the very early uni­verse reveal critical data about its matter density and structure. Amedeo Balbi, a member of ESA’s Planck mission, the successor to WMAP, writes, “The primordial plasma resonated like an enor­mous bell, and the mechanism which started the vibrations could plausibly only be one: a period of inflation that occurred a tiny fraction of second after the big bang.”49

Balbi points out that galaxies are clustered throughout space and they have a very slight preference for spacings that can be thought of as corresponding to sound waves. These galaxy sepa­rations designate grooves or “acoustic peaks,” as in a wave, and represent gravity and temperature variations on the cosmic micro­wave background, which evolved into a subtle imprint on the dis­tribution of galaxies. One wave that’s clearly detected in the galaxy distribution has a scale of 300 million light-years.50 Astrophysicist Jean-Pierre Luminet likewise claims that the early universe “‘rang’ like a musical instrument.” He explains that the variations or peaks and troughs we see in the cosmic microwave background reveal details of the universe’s mass and density in much the same way acoustic waves reverberating through a drum reveal its struc­tural properties. “If you sprinkle sand on the surface of a drum,” writes Luminet, “and then gently vibrate the drum skin, the grains of sand will assemble into characteristic patterns” that reveal data regarding “the size and shape of the drum” or “the physical nature of the drum skin.”51 Similarly, in analyzing the variation in clusters and superclusters of galaxies, we are gathering details about the matter density of the primeval universe.

University of Virginia astronomer Mark Whittle likewise char­acterizes the variations in the microwave background as similar to the crest and trough of sound waves: “The waves are actually very long; they’re many thousands of light years, and so they cor­respond to frequencies, pitch which is very, very low by human standards, roughly 50 octaves below human ears.”52 Whittle has produced a sound file simulating what the big bang would sound like if modulated for the human ear. Describing his recreation of the acoustic peaks in the cosmic microwave background as a “sort of a raw, deep roaring sound,” Whittle is quick to note that there’s “actually musicality present.”53 He describes WMAP’s image of the microwave background as “a microscope. . . a telescope. . . a time machine, all rolled into one, and stored in it is enough infor­mation to kind of diagnose what the character of the universe is today, what its future will be and what its birth was.” Of this “ex­traordinary document,” Whittle reminds us that embedded in the image is the primeval narrative of the universe “written by nature in nature’s own language.”54 COBE and WMAP (and now Planck) have given nature a voice.

Amedeo Balbi observes in The Music of the Big Bang, “Ripples in the matter density of the early Universe had to leave a perma­nent imprint in the ancient cosmic light—as a seal impressed into wax.”55 Cosmologists theorize that etched into the primordial plasma at the beginning of time were density and heat variations that became the galaxy clusters we observe today. Balbi’s meta­phor of matter density fluctuations imprinted on the cosmic mi­crowave background as indentations in wax brings to mind an early method of creating phonograph records by etching grooves in wax. Early sound recordings involved “engraving” data into a wax overlay of a zinc record. Music or voice data were recorded by tracing with a sharp stylus a spiral onto beeswax coating the zinc record. The disc was then treated with chemicals that pre­served the grooves where the stylus had removed the wax, after which the phonograph record could be played.

As early as 1931, Georges Lemaitre apparently wondered whether information about the universe had been recorded in the primordial quantum, even as information is preserved in the grooves of a phonograph record. Lemaitre observed that “the whole story of the [universe] need not have been written down in the first quantum like the song on the disc of a phonograph.”56 However, the WMAP results suggest that, in fact, it was. From Lemaitre to Balbi, the technology of the grooved record and the shape of an acoustic wave served as apt metaphors for peaks in the cosmic microwave background.57 Had we some other technology for recording sound in the time of Lemaitre, perhaps astronomers would have characterized these acoustic peaks in other terms. On the other hand, scientists find that acoustic and electromagnetic waves are means by which the universe, the stars, and planets tell their story. Astronomers and cosmologists, since Pythagoras, have never given up on finding music in the cosmos. And now they have.

X-rays in Popular Culture

News of Rontgen’s discovery of X-rays rippled around the world. “When Rontgen discovered X-rays in November of 1895 by plac­ing his hand between a Crookes Tube and a florescent screen, the medical applications of the technology were immediately appar – ent.”4 By January 1896, Rontgen had issued a report regarding his experiments to media in Europe and the United States. The public was immediately fascinated by the possibility of seeing through seemingly solid objects or inside the human body, and the topic made headlines in newspapers and weeklies. Apparently, X-r ay

X-rays in Popular Culture

Figure 10.1. At the end of the nineteenth century, X-rays were harnessed for medical imaging, where dense material like bones cast a shadow in X-rays. In the astronomical realm, a very hot gas or plasma emits X-rays, as do regions near compact objects like black holes. The X-rays may also be absorbed by intervening material, and they can only be detected by a satellite above the Earth’s atmosphere (NASA/CXC/M. Weiss).

“mania” swept through the public sphere but at a level far sur­passing a simple cultural fad, explains Nancy Knight, who notes that “X-rays appeared in advertising, songs, and cartoons.”5 John Lienhard similarly reports, “Seldom has anything taken hold of the public imagination so powerfully and completely. . . . Right away, magazine cartoons celebrated the idea. A typical one showed a man using an X-ray viewer to see through a lady’s hat at the theatre.”6

Edwin Gerson has investigated the speed with which X-rays were incorporated into the branding of products in the United States, and he explores why so many marketers used the term X – ray to appeal to consumers. Being a medical doctor, Gerson began collecting household products dating back to the 1890s, none of which have anything whatsoever to do with X-rays. One could purchase Sniteman’s X-Ray Liniment for horses and cattle, and Patt’s X-Ray Liniment for people. X-Ray Golf Balls, ostensibly to improve the accuracy of one’s game, were sold by John Wana – maker of New York. There was the D-cell X-Ray flashlight battery, X-Ray Stove Polish, X-Ray Cream Furniture Polish manufactured in New York, and X-Ray Soap made in Port Huron, Michigan. X-Ray Blue Double Edge razor blades were touted as “the fin­est blade known to science,” while drinking fountains for chicken houses were marketed by the X-Ray Incubator Company in Wayne, Nebraska. Housewives could purchase an X-ray Coffee Grinder or the X-Ray lemon squeezer, and the X-Ray Raisin Seeder was available as early as November 1896. A company from Baltimore, Maryland, sold boxes of X-Ray headache tablets, with 8 pills for ten cents promising relief in just fifteen minutes.7 Clearly, adver­tising by means of non sequitur is not just a phenomenon of the modern age.

The popular fascination with X-rays continued for decades. By 1924, an X-ray shoe fitter was deployed by shoe vendors to image both feet inside a new pair of shoes. David Lapp reports that in the United States “there were approximately 10,000 of these fluo – roscopes in use, being made by companies such as Adrian X-Ray Shoe Fitter,” and that by the early 1950s most shoe stores were using the devices.8 As Gerson points out, “The public was simply astonished with X rays, and advertisers played off this spellbound attention by adding the name to almost any type of product. . . . Not only did the image of the X ray convey a sense of cutting-edge technology, it also functioned as a metaphor for ‘powerful unseen truth and strength.’”9

Researchers and medical personnel working with X-rays were frequently exposed to dangerous or fatal levels of radiation, in­cluding Elizabeth Fleischmann, who at age 28 read a news article on how to build an X-ray device and by 1900 became the best medical radiologist in the United States. But in ten years’ time, Fleischmann had been so badly overexposed to radiation by im­aging her patients and developing the films that she did not sur – vive.10 At the time, the effect of exposure to radiation was poorly understood and this ignorance played out in dangerous exposure for both medical practitioners and those working with the new technology for purposes of entertainment. Nancy Knight, for in­stance, indicates that “papers reported daily” on Thomas Edison’s efforts to X-ray a person’s brain in order to figure out how the brain functions.11

Allen Grove reports that some speculated at the time that the new technology might afford a kind of X-ray vision that might make it possible to capture on film the images of ghosts, appar­ently a popular notion in England. He also comments that within months of Rontgen’s announcement, theaters were headlining performances inspired by the popularity of X-rays.12 Piano sheet music for American composer Harry L. Tyler’s “X Ray Waltzes” from 1896 depicted on its cover a man holding his hand under an X-ray tube. Beneath the man’s hand appears a skeletal X-ray image. In fact, in 2010, Tyler’s waltzes were dusted off and fea­tured in a BBC broadcast titled “Images that Changed the World.” And, any discussion of X-rays in popular culture must recall that in the 1930s, when writer Jerry Siegel and artist Joe Shuster in­vented the prototypical superhero, it was inevitable that Superman would be gifted with X-ray vision. Though Superman didn’t have such ability at the outset, in later adventures he is able to see in multiple wavelengths of the electromagnetic spectrum, including radio waves, infrared, ultraviolet, and eventually X-rays.13

Rontgen’s discovery had a deep shaping effect on the arts. This was because X-rays were an entree into a hidden world, the “world within the world” represented by the interior structure of atoms and molecules. In 1912, less than twenty years after the initial dis­covery, physicist Max von Laue showed that X-rays were a form of electromagnetic radiation because they diffracted when inter­acting with matter. A year later, the father and son team of William Henry and William Lawrence Bragg described mathematically how X-rays scattered within a crystal, winning the Nobel Prize in Physics for their work in 1915. This opened the door to X-ray crystallography, a powerful tool for measuring the spacing and arrangement of atoms within a solid. The impact of this discovery was particularly strong in the visual arts, which were undergoing their own revolution with the onset of Fauvism, Cubism, and Fu­turism. The X-ray was liberating because to artists it “proved that the external is not valid, it’s just a false layer.”14

Art historian Linda Dalrymple Henderson contends that X-rays suggested the possibility of stepping into the fourth dimension. She writes, “From the 1880’s to the 1920’s, popular fascination with an invisible, higher dimension of space—of which our famil­iar world might be only a section or shadow—is readily apparent in the vast number of articles and the books. . . published on the topic.” Henderson has demonstrated that modern artists read­ily embraced X-rays, and their ability to expose realities and per­spectives not perceptible to the human eye, as suggestive of four­dimensional space.15 Cubist paintings, with their simultaneous depiction of all sides of a seemingly transparent object, and their suggestion of interior planes, explains Henderson, “are testaments to the new paradigm of reality ushered in by the discovery of X – rays and interest in the fourth dimension. Such paintings are new kinds of ‘windows’—in this case, into the complex, invisible reality or higher dimensional world as imagined by the artist.”16 The in­spiration was sometimes very direct. According to historian Arthur Miller, “Picasso’s Standing Female Nude” (1910) was inspired by the power of X-rays to glimpse beyond the visible: what you see is not what you get. In this case, the inspiration was X-ray photo­graphs taken to diagnose the illness of Picasso’s mistress, Fernande Olivier. Superposed on a background of planes, her body lies open to reveal pelvic hip bones made up of geometrical shapes: forms reduced to geometry—the aesthetic of Cubism, inspired by mod­ern science.”17 From the arts, to medicine, and particularly through astronomy and space exploration, X-rays have profoundly altered human culture.