Most lightning forms in the negatively charged region under the base of a thunderstorm, whence negative charge is transferred from the cloud to the ground. This so-called "negative lightning” accounts for over 95 percent of strikes. An average bolt of negative lightning carries an electric current of 30 kA, transferring a charge of 5 coulombs, with energy of 500 megajoules (MJ). Large lightning bolts can carry up to 120 kA and 350 coulombs. The voltage is proportional to the length of the bolt.[117]
Some lightning originates near the top of the thunderstorm in its cirrus anvil, a region of high positive charge. Lightning formed in the upper area behaves similarly to discharges in the negatively charged storm base, except that the descending stepped leader carries a positive charge, while its subsequent ground streamers are negative. Bolts thus created are called "positive lightning,” because they deliver a net positive charge from the cloud to the ground. Positive lightning usually consists of a single stroke, while negative lightning typically comprises two or more strokes. Though less than 5 percent of all strikes consist of positive lightning, it is particularly dangerous. Because it originates in the upper levels of a storm, the amount of air it must burn through to reach the ground is usually much greater. Therefore, its electric field typically is much stronger than a negative strike would be and generates enormous amounts of extremely low frequency (ELF) and VLF waves. Its flash duration is longer, and its peak charge and potential are 6 to 10 times greater than a negative strike, as much as 300 kA and 1 billion volts!
Some positive lightning happens within the parent thunderstorm and hits the ground beneath the cloud. However, many positive strikes occur near the edge of the cloud or may even land more than 10 miles away, where perhaps no one would recognize risk or hear thunder.
Such positive lightning strikes are called "bolts from the blue.” Positive lightning may be the main type of cloud-to-ground during winter months or develop in the late stages of a thunderstorm. It is believed to be responsible for a large percentage of forest fires and power-line damage, and poses a threat to high-flying aircraft. Scientists believe that recently discovered high-altitude discharges called "sprites” and "elves” result from positive lightning. These phenomena occur well above parent thunderstorms, at heights from 18 to 60 miles, in some cases reaching heights traversed only by transatmospheric systems such as the Space Shuttle.
Lightning is by no means a uniformly damaging force. For example, fires started by lightning are necessary in the life cycles of some plants, including economically valuable tree species. It is probable that, thanks to the evolution and spread of land plants, oxygen concentrations achieved the 13-percent level required for wildfires before 420 million years ago, in the Paleozoic Era, as evinced by fossil charcoal, itself proof of lightning-caused range fires.
In 2003, NASA-funded scientists learned that lightning produces ozone, a molecule composed of three oxygen atoms. High up in the stratosphere (about 6 miles above sea level at midlatitudes), ozone shields the surface of Earth from harmful ultraviolet radiation and makes the land hospitable to life, but low in the troposphere, where most weather occurs, it’s an unwelcome byproduct of manmade pollutants. NASA’s researchers were surprised to find that more low-altitude ozone develops naturally over the tropical Atlantic because of lightning than from the burning of fossil fuels or vegetation to clear land for agriculture.
Outdoors, humans can be injured or killed by lightning directly or indirectly. No place outside is truly safe, although some locations are more exposed and dangerous than others. Lightning has harmed victims in improvised shelters or sheds. An enclosure of conductive material does, however, offer refuge. An automobile is an example of such an elementary Faraday cage.
Property damage is more common than injuries or death. Around a third of all electric power-line failures and many wildfires result from lightning. (Fires started by lightning are, however, significant in the natural life cycle of forests.) Electrical and electronic devices, such as telephones, computers, and modems, also may be harmed by lightning, when overcurrent surges fritz them out via plug-in outlets, phone jacks, or Ethernet cables.
The Lightning Hazard in Aeronautics and Astronautics: A Brief Synopsis
Since only about one-fourth of discharges reach Earth’s surface, lightning presents a disproportionate hazard to aviation and rocketry. Commercial aircraft are frequently struck by lightning, but airliners are built to reduce the hazard, thanks in large part to decades of NASA research. Nevertheless, almost every type of aircraft has been destroyed or severely damaged by lightning, ranging from gliders to jet airliners. The following is a partial listing of aircraft losses related to lightning:
• August 1940: a Pennsylvania Central Airlines Douglas DC-3A dove into the ground near Lovettsville, VA, killing all 25 aboard (including Senator Ernest Lundeen of Minnesota), after "disabling of the pilots by a severe lightning discharge in the immediate neighborhood of the airplane, with resulting loss of control.”[118]
• June 1959: a Trans World Airlines (TWA) four-engine Lockheed Starliner with 68 passengers and crew was destroyed near Milan, Italy.
• August 1963: a turboprop Air Inter Vickers Viscount crashed on approach to Lyon, France, killing all 20 on board plus 1 person on the ground.
• December 1963: a Pan American Airlines Boeing 707 crashed at night when struck by lightning over Maryland.
All 82 aboard perished.
• April 1966: Abdul Salam Arif, President of Iraq, died in a helicopter accident, reportedly in a thunderstorm that could have involved lightning.
• April 1967: an Iranian Air Force C-130B was destroyed by lightning near Mamuniyeh. The 23 passengers and crew all died.
• Christmas Eve 1971: a Lockheed Electra of Lmeas Aereas Nacionales Sociedad Anonima (LANSA) was destroyed over Peru with 1 survivor among 92 souls on board.
• May 1976: an Iranian Air Force Boeing 747 was hit during descent to Madrid, Spain, killing all 17 aboard.
• November 1978: a U. S. Air Force (USAF) C-130E was struck by lightning near Charleston, SC, and fatally crashed, with six aboard.
• September 1980: a Kuwaiti C-130 crashed after a lightning strike near Montelimar, France. The eight-man crew was killed.
• February 1988: a Swearingen Metro operated by Nurnberger Flugdienst was hit near Mulheim, Germany, with all 21 aboard killed.
• January 1995: a Super Puma helicopter en route to a North Sea oil platform was struck in the tail rotor, but the pilot autorotated to a water landing. All 16 people aboard were safely recovered.
• April 1999: a British glider was struck, forcing both pilots to bail; they landed safely.
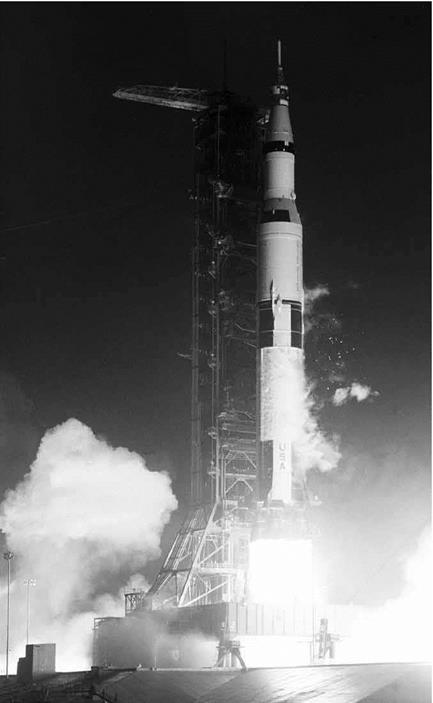
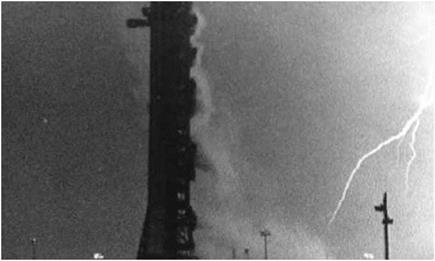
Additionally, lightning posed a persistent threat to rocket-launch operations, forcing extensive use of protective systems such as lightning rods and "tripwire” devices. These devices included small rockets trailing conductive wires that can trigger premature cloud-to-ground strokes, reducing the risk of more powerful lightning strokes. The classic example was the launch of Apollo 12, on November 14, 1969. "The flight of Apollo 12,” NASA historian Roger E. Bilstein has written, "was electrifying, to say the least.”[119]
During its ascent, it built up a massive static electricity charge that abruptly discharged, causing a brief loss of power. It had been an exceptionally close call. Earlier, the launch had been delayed while technicians dealt with a liquid hydrogen leak. Had a discharge struck the fuel-air mix of the leak, the conflagration would have been disastrous. Of course, three decades earlier, a form of lightning (a brush discharge, commonly called "St. Elmo’s fire”) that ignited a hydrogen gas-air mix was blamed by investigators for the loss of the German airship Hindenburg in 1937 at Lakehurst, NJ.[120]
Flight Research on Lightning
Benjamin Franklin’s famous kite experiments in the 1750s constituted the first application of lightning’s effect upon "air vehicles.” Though it is uncertain that Franklin personally conducted such tests, they certainly were done by others who were influenced by him. But nearly 200 years passed before empirical data were assembled for airplanes.[121]
Probably the first systematic study of lightning effects on aircraft was conducted in Germany in 1933 and was immediately translated by NASA’s predecessor, the National Advisory Committee on Aeronautics (NACA). German researcher Heinrich Koppe noted diverse opinions on the subject. He cited the belief that any aircraft struck by lightning "would be immediately destroyed or at least set on fire,” and, contrarily, that because there was no direct connection between the aircraft and the ground, "there could be no force of attraction and, consequently, no danger.”[122]
Koppe began his survey detailing three incidents in which "the consequences for the airplanes were happily trivial.” However, he expanded the database to 32 occasions in 6 European nations over 8 years. (He searched for reports from America but found none at the time.) By discounting incidents of St. Elmo’s fire and a glider episode, Koppe had 29 lightning strikes to evaluate. All but 3 of the aircraft struck had extended trailing antennas at the moment of impact. His conclusion was that wood and fabric aircraft were more susceptible to damage than were metal airframes, "though all-metal types are not immune.” Propellers frequently attracted lightning, with metal-tipped wooden blades being more susceptible than all-metal props. While no fatalities occurred with the cases in Koppe’s studies, he did note disturbing effects upon aircrew, including temporary blindness, short-term stunning, and brief paralysis; in each case, fortunately, no lingering effects occurred.[123]
Koppe called for measures to mitigate the effects of lightning strikes, including housing of electrical wires in metal tubes in wood airframes and "lightning protection plates” on the external surfaces. He said radio masts and the sets themselves should be protected. One occasionally overlooked result was "electrostriction,” which the author defined as "very heavy air pressure effect.” It involved mutual attraction of parallel tracks into the area of the current’s main path. Koppe suggested a shield on the bottom of the aircraft to attract ionized air. He concluded: "airplanes are not ‘hit’ by lightning, neither do they ‘accidentally’ get into the path of a stroke. The hits to airplanes are rather the result of a release of more or less heavy electrostatic discharges whereby the airplane itself forms a part of the current path.”[124]
American studies during World War II expanded upon prewar examinations in the United States and elsewhere. A 1943 National Bureau of Standards (NBS, now the National Institute for Standards and Technology, NIST) analysis concluded that the power of a lightning bolt was so enormous—from 100 million to 1 billion volts—that there was "no possibility of interposing any insulating barrier that can effectively resist it.” Therefore, aircraft designers needed to provide alternate paths for the discharge via "lightning conductors.”[125] Postwar evaluation reinforced Koppe’s 1933 observations, especially regarding lightning effects upon airmen: temporary blindness (from seconds to 10 minutes), momentary loss of hearing, observation of electrical effects ranging from sparks to "a blinding blue flash,” and psychological effects. The latter were often caused more by the violent sensations attending the entrance of a turbulent storm front rather than a direct result of lightning.[126]
Drawing upon British data, the NACA’s 1946 study further detailed atmospheric discharges by altitude bands from roughly 6,500 to 20,500 feet, with the maximum horizontal gradient at around 8,500 feet. Size and configuration of aircraft became recognized factors in lightning, owing to the greater surface area exposed to the atmosphere. Moisture and dust particles clinging to the airframe had greater potential for drawing a lightning bolt than on a smaller aircraft. Aircraft speed also was considered, because the ram-air effect naturally forced particles closer together.[127]
A Weather Bureau survey of more than 150 strikes from 1935 to 1944 defined a clear "danger zone”: aircraft flying at or near freezing temperatures and roughly at 1,000 to 2,000 feet above ground level (AGL). The most common factors were 28-34 °F and between 5,000 and 8,000 feet AGL. Only 15 percent of strikes occurred above 10,000 feet.[128]
On February 19, 1971, a Beechcraft B90 King Air twin-turboprop business aircraft owned by Marathon Oil was struck by a bolt of lightning while descending through 9,000 feet preparatory to landing at Jackson, MI. The strike caused "widespread, rather severe, and unusual” damage. The plane suffered "the usual melted metal and cracked nonmetallic materials at the attachments points” but in addition suffered a local structural implosion on the inboard portions of the lower right wing between the fuselage and right engine nacelle, damage to both flaps, impact-and-crush-type damage to one wingtip at an attachment point, electrical arc pitting of flap support and control rod bearings, a hole burned in a ventral fin, missing rivets, and a brief loss of power. "Metal skins were distorted,” NASA inspectors noted, "due to the ‘magnetic pinch effect’ as the lightning current flowed through them.” Pilots J. R. Day and J. W. Maxie recovered and landed the aircraft safely. Marathon received a NASA commendation for taking numerous photographs of record and contacting NASA so that a much more detailed examination could be performed.[129]
The jet age brought greater exposure to lightning, prompting further investigation by NOAA (created in 1970 to succeed the Environmental Science Services Administration, which had replaced the Weather Bureau in 1965). The National Severe Storms Laboratory conducted Project Rough Rider, measuring the physical characteristics and effects of thunderstorms, including lightning. The project employed two-seat F-100F and T-33A jets to record the intensity of lightning strikes over Florida and Oklahoma in the mid-1960s and later. The results of the research flights were studied and disseminated to airlines, providing safety guidelines for flight in the areas of thunderstorms.[130]
In December 1978, two Convair F-106A Delta Dart interceptors were struck within a few minutes near Castle Air Force Base (AFB), CA. Both had lightning protection kits, which the Air Force had installed beginning in early 1976. One Dart was struck twice, with both jets sustaining "severe” damage to the Pitot booms and area around the radomes. The protection kits prevented damage to the electrical systems, though subsequent tests determined that the lightning currents well exceeded norms, in the area of 225 kA. One pilot reported that the strike involved a large flash, and that the impact felt "like someone hit the side of the aircraft with a sledgehammer.” The second strike a few minutes later exceeded the first. The report concluded that absent the protection kits, damage to electrical and avionic systems might have been extensive.[131]
Though rare, other examples of dual aircraft strikes have been recorded. In January 1982, a Grumman F-14A Tomcat was en route to the Grumman factory at Calverton, NY, flown by CDR Lonny K. McClung from Naval Air Station (NAS) Miramar, CA, when it was struck by lightning. The incident offered a dramatic example of how a modern, highly sophisticated aircraft could be damaged, and its safety compromised, by a lightning strike. As CDR McClung graphically recalled:
We were holding over Calverton at 18,000 waiting for a rainstorm to pass. A lightning bolt went down about half a mile in front of us. An arm reached out and zapped the Pitot probe on the nose. I saw the lightning bolt go down and almost as if a time warp, freeze frame, an arm of that lightning came horizontal to the nose of our plane.
It shocked me, but not badly, though it fried every computer in the airplane—Grumman had to replace everything. Calverton did not open in time for us to recover immediately so we had to go to McGuire AFB (112 miles southwest) and back on the "peanut gyro” since all our displays were fried. With the computers zapped, we had a bit of an adventure getting the plane going again so we could go to Grumman and get it fixed. When we got back to Calverton, one of the linemen told us that the same lightning strike hit a news helo below us. Based on the time, we were convinced it was the same strike that got us. An eerie feeling.[132]
The 1978 F-106 Castle AFB F-106 strikes stimulated further research on the potential danger of lightning strikes on military aircraft, particularly as the Castle incidents involved currents beyond the strength usually encountered.
Coincidentally, the previous year, the National Transportation Safety Board had urged cooperative studies among academics, the aviation community, and Government researchers to address the dangers posed to aircraft operations by thunderstorms. Joseph Stickle and Norman Crabill of the NASA Langley Research Center, strongly supported by Allen Tobiason and John Enders at NASA Headquarters, structured a comprehensive program in thunderstorm research that the Center could pursue. The next year, Langley researchers evaluated a lightning location detector installed on an Agency light research aircraft, a de Havilland of Canada DHC-6 Twin Otter. But the most extensive and prolonged study NASA undertook involved, coincidentally, the very sort of aircraft that had figured so prominently in the Castle AFB strikes: a two-seat NF-106B Delta Dart, lent from the Air Force to NASA for research purposes.[133]
The NASA Langley NF-106B lightning research program began in 1980 and continued into 1986. Extensive aerial investigations were undertaken after ground testing, modeling, and simulation.[134] Employing the NF-106B, Langley researchers studied two subjects in particular: the mechanisms influencing lightning-strike attachments on aircraft and the electrical and physical effects of those strikes. Therefore, the Dart was fitted with sensors in 14 locations: 9 in the fuselage plus 3 in the wings and 2 in the vertical stabilizer. In all, the NF-106B sustained 714 strikes during 1,496 storm penetrations at altitudes from 5,000 to 50,000 feet, typically flying within a 150-mile radius of its operating base at Langley.[135] One NASA pilot—Bruce Fisher—experienced 216 lightning strikes in the two – seat Dart. Many test missions involved multiple strikes; during one 1984 research flight at an altitude of 38,000 feet through a thunderstorm, the NF-106B was struck 72 times within 45 minutes, and the peak recorded on that particular test mission was an astounding 9 strikes per minute.[136]
NASA’s NF-106B lightning research program constituted the single most influential flight research investigation undertaken in atmospheric electromagnetic phenomena by any nation. The aircraft, now preserved in an aviation museum, proved one of the longest-lived and most productive of all NASA research airplanes, retiring in 1991. As a team composed of Langley Research Center, Old Dominion University, and Electromagnetic Applications, Inc., researchers reported in 1987:
This research effort has resulted in the first statistical quantification of the electromagnetic threat to aircraft based on in situ measurements. Previous estimates of the in-flight lightning hazard to aircraft were inferred from ground-based measurements. The electromagnetic measurements made on the F-106 aircraft during these strikes have established a statistical basis for determination of quantiles and "worst-case” amplitudes of electromagnetic parameters of rate of change of current and the rate of change of electric flux density. The 99.3 percentile of the peak rate of change of current on the F-106 aircraft struck by lightning is about two and a half times that of previously accepted airworthiness criteria. The findings are at present being included in new criteria concerning protection of aircraft electrical and electronic systems against lightning. Since there are at present no criteria on the rate of change of electric flux density, the new data can be used as the basis for new criteria on the electric characteristics of lightning – aircraft electrodynamics. In addition to there being no criteria on the rate of change of electric flux density, there are also no criteria on the temporal durations of this rate of change or rate of change of electric current exceeding a prescribed value. Results on pulse characteristics presented herein can provide the basis for this development. The newly proposed lightning criteria and standards are the first which reflect actual aircraft responses to lightning measured at flight altitudes.[137]
The data helped shape international certification and design standards governing how aircraft should be shielded or hardened to minimize damage from lightning. Recognizing its contributions to understanding the lightning phenomena, its influence upon design standards, and its ability to focus the attention of lightning researchers across the Federal Government, the Flight Safety Foundation accorded the NF-106B program recognition as an Outstanding Contribution to Flight Safety for 1989. This did not mark the end of the NF-106B’s electromagnetic research, however, for it was extensively tested at the Air Force Weapons Laboratory at Kirtland AFB, NM, in a cooperative Air Force-NASA study comparing lightning effects with electromagnetic pulses produced by nuclear explosions.[138]
As well, the information developed in F-106B flights led to extension of "triggered” (aircraft-induced) lightning models applied to other aircraft. Based on scaling laws for triggering field levels of differing airframe sizes and configurations, data were compiled for types as diverse as Lockheed C-130 airlifters and light, business aircraft, such as the Gates (now Bombardier) Learjet. The Air Force operated a Lockheed WC-130 during 1981, collecting data to characterize airborne lightning. Operating in Florida, the Hercules flew at altitudes between 1,500
|
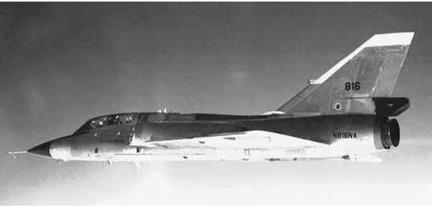
The workhorse General Dynamics NF-106B Delta Dart used by NASA for a range of electromagnetic studies and research. NASA.
|
and 18,000 feet, using 11 sensors to monitor nearby thunderstorms. The flights were especially helpful in gathering data on intercloud and cloud-to-ground strokes. More than 1,000 flashes were recorded by analog and 500 digitally.[139]
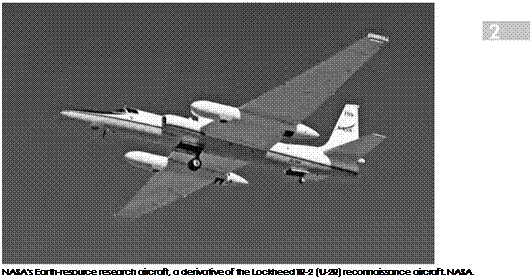
High-altitude research flights were conducted in 1982 with instrumented Lockheed U-2s carrying the research of the NF-106B and the WC-130 at lower altitudes well into the stratosphere. After a smaller 1979 project, the Thunderstorm Overflight Program was cooperatively sponsored by NASA, NOAA, and various universities to develop criteria for a lightning mapping satellite system and to study the physics of lightning. Sensors included a wide-angle optical pulse detector, electric field change meter, optical array sensor, broadband and high-resolution Ebert spectrometers, cameras, and tape recorders. Flights recorded data from Topeka, KS, in May and from Moffett Field, CA, in August. The project collected some 6,400 data samples of visible pulses, which were analyzed by NASA and university researchers.[140] NASA expanded the studies to include
flights by an Agency Lockheed ER-2, an Earth-resources research aircraft derived from the TR-2, itself a scaled-up outgrowth of the original U-2.[141]
Complementing NASA’s lightning research program was a cooperative program of continuing studies at lower altitudes undertaken by a joint American-French study team. The American team consisted of technical experts and aircrew from NASA, the Federal Aviation Administration (FAA), the USAF, the United States Navy (USN), and NOAA, using a specially instrumented American Convair CV-580 twin – engine medium transport. The French team was overseen by the Offices Nationales des Etudes et Recherches Aerospatiales (National Office for Aerospace Studies and Research, ONERA) and consisted of experts and aircrew from the Centre d’Essais Aeronautique de Toulouse (Toulouse Aeronautical Test Center, CEAT) and the l’Armee de l’Air (French Air Force) flying a twin-engine medium airlifter, the C-160 Transall. The Convair was fitted with a variety of external sensors and flown into thunderstorms over Florida in 1984 to 1985 and 1987. Approximately 60 strikes were received, while flying between 2,000 and 18,000 feet. The hits were categorized as lightning, lightning attachment, direct strike, triggered strike, intercepted strike, and electromagnetic pulse. Flight tests revealed a high proportion of strikes initiated by the aircraft itself. Thirty-five of thirty-nine hits on the CV-580 were determined to be aircraft-induced. Further data were obtained by the C-160 with highspeed video recordings of channel formation, which reinforced the opinion that aircraft initiate the lightning. The Transall operated over southern France (mainly near the Pyrenees Mountains) in 1986-1988, and CEAT furnished reports from its strike data to the FAA, and thence to other agencies and industry.[142]
 |
Electrodynamic Research Using UAVs
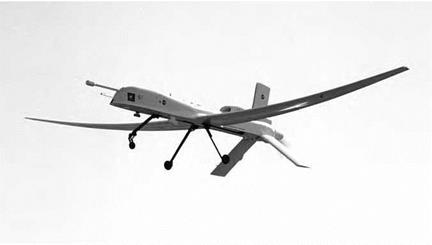
Reflecting their growing acceptance for a variety of military missions, unmanned ("uninhabited”) aerial vehicles (UAVs) are being increasingly used for atmospheric research. In 1997, a Goddard Space Flight Center space sciences team consisting of Richard Goldberg, Michael Desch, and William Farrell proposed using UAVs for electrodynamic studies. Much research in electrodynamics centered upon the direct-current (DC) Global Electric Circuit (GEC) concept, but Goldberg and his colleagues wished to study the potential upward electrodynamic flow from thunderstorms. "We were convinced there was an upward flow,” he recalled over a decade later, "and [that] it was AC.”[143] To study upward flows, Goldberg and his colleagues decided that a slow-flying, high-altitude UAV had advantages of proximity and duration that an orbiting spacecraft did not. They contacted Richard Blakeslee at Marshall Space Flight Center, who had a great interest in Earth sciences research. The Goddard-Marshall part-
|
NASA Altus 2 electrodynamic research aircraft, a derivative of the General Atomics Predator UAV, in flight on July12, 2002. NASA.
|
nership quickly secured Agency support for an electrodynamic UAV research program to be undertaken by the National Space Science and Technology Center (NSSTC) at Huntsville, AL. The outcome was Altus, a modification of the basic General Atomics Predator UAV, leased from the manufacturer and modified to carry a NASA electrodynamic research package. Altus could fly as slow as 70 knots and as high as 55,000 feet, cruising around and above (but never into) Florida’s formidable and highly energetic thunderstorms. First flown in 2002, Altus constituted the first time that UAV technology had been applied to study electrodynamic phenomena.[144] Initially, NASA wished to operate the UAV from Patrick AFB near Cape Canaveral, but concerns about the potential dangers of flying a UAV over a heavily populated area resulted in switching its operational location to the more remote Key West Naval Air Station. Altus flights confirmed the suppositions of Goldberg and his colleagues, and it complemented other research methodologies that took electric, magnetic, and optical measurements of thunderstorms, gauging lightning
|
The launch of Apollo 12 from the John F. Kennedy Space Center in 1969. NASA.
|
activity and associated electrical phenomena, including using ground – based radars to furnish broader coverage for comparative purposes.[145]
While not exposing humans to thunderstorms, the Altus Cumulus Electrification Study (ACES) used UAVs to collect data on cloud properties throughout a 3- or 4-hour thunderstorm cycle—not always possible with piloted aircraft. ACES further gathered material for threedimensional storm models to develop more-accurate weather predictions.
|
Lightning bolt photographed at the John F. Kennedy Space Center immediately after the launch of Apollo 12 in November 1969. NASA.
|
![]() In 1993, responding to anticipated increases in air travel demand, NASA established a Terminal Area Productivity program to increase airliner throughput at the Nation’s airports by at least 12 percent over existing levels of service. TAP consisted of four interrelated subelements: air traffic management, reduced separation operations, integration between aircraft and air traffic control (ATC), and Low Visibility Landing and Surface Operations (LVLASO).[1145]
In 1993, responding to anticipated increases in air travel demand, NASA established a Terminal Area Productivity program to increase airliner throughput at the Nation’s airports by at least 12 percent over existing levels of service. TAP consisted of four interrelated subelements: air traffic management, reduced separation operations, integration between aircraft and air traffic control (ATC), and Low Visibility Landing and Surface Operations (LVLASO).[1145]![]() In July and August 1997, NASA Langley flight researchers undertook two sequential series of air and ground tests at Atlanta International Airport, using a NASA Boeing 757-200 series twin-jet narrow-body transport equipped with Langley-developed experimental cockpit displays. This permitted surface operations in visibility conditions down to a runway visual range (RVR) of 300 feet. Test crews included NASA pilots for the first series of tests and experienced airline captains for the second. All together, it was the first time that SVS had been demonstrated at a major airport using a large commercial jetliner.[1148]
In July and August 1997, NASA Langley flight researchers undertook two sequential series of air and ground tests at Atlanta International Airport, using a NASA Boeing 757-200 series twin-jet narrow-body transport equipped with Langley-developed experimental cockpit displays. This permitted surface operations in visibility conditions down to a runway visual range (RVR) of 300 feet. Test crews included NASA pilots for the first series of tests and experienced airline captains for the second. All together, it was the first time that SVS had been demonstrated at a major airport using a large commercial jetliner.[1148]![]() NASA created the High-Speed Research program in 1990 to investigate technical challenges involved with developing a Mach 2+ HSCT. Phase I of the HSR program was to determine if major environmental obstacles could be overcome, including ozone depletion, community noise, and sonic boom generation. NASA and its industry partners determined that the state of the art in high-speed design would allow mitigation of the ozone and noise issues, but sonic boom mitigation remained elusive.[1152]
NASA created the High-Speed Research program in 1990 to investigate technical challenges involved with developing a Mach 2+ HSCT. Phase I of the HSR program was to determine if major environmental obstacles could be overcome, including ozone depletion, community noise, and sonic boom generation. NASA and its industry partners determined that the state of the art in high-speed design would allow mitigation of the ozone and noise issues, but sonic boom mitigation remained elusive.[1152]![]() With the extensive general-aviation highway-in-the-sky experience at Langley, researchers began to expand their focus in the early 1990s to include more sophisticated applications to commercial and business aircraft. This included investigating the no-droop nose requirements of the conceptual High-Speed Civil Transport, which lacked side windows and had such a forward-placed cockpit in relation to the nose wheel of the vehicle—over 50 feet separated the two—as to pose serious challenges for precise ground maneuvering. As the High-Speed Research program became more organized, disciplines became grouped into Integrated Technology Development (ITD) Teams.[1154] An XVS element was established in the Flight Deck ITD Team, led by Langley’s Daniel G. Baize. Because the HSR program contained so many member organizations, each with its own prior conceptions, it was thought that the ITD concept would be effective in bringing the disparate organizations together. This did not always lead to an efficient program or rapid progress. Partly, this was due to the requirement that consensus must be reached on all ITD Team decisions, a Skunk Works process in reverse. In the case of the XVS element, researchers from NASA Langley and NASA Ames Research Centers joined industry colleagues from Boeing, Douglas, Calspan, and others in designing a system from the bottom up.[1155]
With the extensive general-aviation highway-in-the-sky experience at Langley, researchers began to expand their focus in the early 1990s to include more sophisticated applications to commercial and business aircraft. This included investigating the no-droop nose requirements of the conceptual High-Speed Civil Transport, which lacked side windows and had such a forward-placed cockpit in relation to the nose wheel of the vehicle—over 50 feet separated the two—as to pose serious challenges for precise ground maneuvering. As the High-Speed Research program became more organized, disciplines became grouped into Integrated Technology Development (ITD) Teams.[1154] An XVS element was established in the Flight Deck ITD Team, led by Langley’s Daniel G. Baize. Because the HSR program contained so many member organizations, each with its own prior conceptions, it was thought that the ITD concept would be effective in bringing the disparate organizations together. This did not always lead to an efficient program or rapid progress. Partly, this was due to the requirement that consensus must be reached on all ITD Team decisions, a Skunk Works process in reverse. In the case of the XVS element, researchers from NASA Langley and NASA Ames Research Centers joined industry colleagues from Boeing, Douglas, Calspan, and others in designing a system from the bottom up.[1155]![]() From 1994 to 1996, Langley hosted a series of workshops concerning concepts for commercial transports, including tunnel-, pathway-, and highway-in-the-sky concepts.[1156] The first two workshops examined potential display concepts and the maturity of underlying technologies, with attendees debating the merits of approaches and their potential utility. The final workshop, the Third XVS Symbology Workshop (September 4-5, 1996), focused on XVS applications for the HSCT. Led by the Flight Deck Integrated Display Symbology Team of Dr. Terrence Abbott and Russell Parrish, from Langley, and Andrew Durbin, Gordon Hardy, and Mary Kaiser, from Ames, the workshop provided an opportunity for participants from related ITD Teams to exchange ideas. Because the sensor image would be the primary means of traffic separation in VMC, display clutter was a major concern. The participants developed the minimal symbology set for the XVS displays to include the virtual out-the-window display and the head-down PFD. The theme of the workshop became, "Less is best, lest we obscure the rest.” [1157]
From 1994 to 1996, Langley hosted a series of workshops concerning concepts for commercial transports, including tunnel-, pathway-, and highway-in-the-sky concepts.[1156] The first two workshops examined potential display concepts and the maturity of underlying technologies, with attendees debating the merits of approaches and their potential utility. The final workshop, the Third XVS Symbology Workshop (September 4-5, 1996), focused on XVS applications for the HSCT. Led by the Flight Deck Integrated Display Symbology Team of Dr. Terrence Abbott and Russell Parrish, from Langley, and Andrew Durbin, Gordon Hardy, and Mary Kaiser, from Ames, the workshop provided an opportunity for participants from related ITD Teams to exchange ideas. Because the sensor image would be the primary means of traffic separation in VMC, display clutter was a major concern. The participants developed the minimal symbology set for the XVS displays to include the virtual out-the-window display and the head-down PFD. The theme of the workshop became, "Less is best, lest we obscure the rest.” [1157]


