Category Archimedes

THE REVIVAL OF THE WOODEN AIRPLANE

Americans were not alone in the shift to metal in the interwar period; aviation technology had little respect for national boundaries. Although there were distinct design styles in particular firms, all the major industrialized powers followed the same general pattern with regard to airplane materials. By 1939, the air forces of Germany, France and Britain had all converted to metal structures, with aluminum alloys preferred. Italy and the Soviet Union lagged behind somewhat, continuing to use wood for some combat airplanes, but the trend in those countries was clearly towards metal as well.

Nevertheless, in the late 1930s, wood was poised for a significant revival in aircraft structures. Despite the apparent triumph of the all-metal airplane, wood construction had not remained static. In Germany, Britain and the United States, a few aviation researchers and airplane designers began exploring new construction techniques during the 1930s using synthetic resin adhesives. These new adhesives, which were based on common phenol-formaldehyde thermosetting plastics, eliminated the worst problems of traditional wood glues, especially the tendency to deteriorate when damp. In addition, the synthetic resins made possible significant improvements in the strength properties of laminated wood products, while permitting the use of various molding techniques that promised substantial savings in labor.9

In the United States, interest in the new adhesives was driven by the high skill levels and labor inputs required to manufacture all-metal airplanes. For metal airplanes, the key problem lay with the lowly rivet, a fastener required by the difficulty of welding heat-treated aluminum alloy. A small training airplane could require 50,000 rivets, and a large bomber nearly ten times as many; riveting accounted for some 40 percent of the costs of a typical airframe.10 According to Virginius E. Clark, a prominent American aeronautical engineer, “any type of structure which demanded such a multiplicity of reinforcing parts and so many thousands of rivets did not constitute the best final answer for rapid and inexpensive production.”11 In addition, rivets made it very difficult to obtain the extremely smooth external surfaces needed by high-speed airplanes. Although engineers developed various methods of flush riveting to deal with this problem, smooth riveted surfaces remained difficult and expensive to manufacture.12

Around 1935, Sherman Fairchild, president of the Fairchild Engine and Airplane Corporation, began to have doubts about the suitability of riveted all-metal construction for quantity production and high-speed flight. Fairchild assigned the task of eliminating the rivet to Clark, who was then Fairchild’s vice president for engineering. Clark turned his attention to resin-bonded wood veneers, which could be molded into large curved panels to produce a well-streamlined airframe. Clark began working with the Haskelite Manufacturing Corporation, formerly a major supplier of aircraft plywood. The Fairchild and Haskelite companies jointly developed a bag-molding technique for producing airplane parts of resin-bonded plywood, termed “Duramold” by Clark. In 1937 Clark designed a five-place commercial airplane with a Duramold fuselage, the Fairchild F-46, which completed its first flight on Dec. 5, 1937.13

Clark faced tremendous practical difficulties in developing manufacturing techniques using the new adhesives. The Duramold process represented a synthesis of two lines of development in wood products: molded plywood and resin-bonded “improved” wood. Bag-molding techniques were not new to airplane construction, having been used on the Lockheed Vega, the most successful high-speed airplane of the late 1920s. But in contrast to the casein-glued Vega fuselage, the thermosetting resins in Duramold required molding pressures as high as 100 psi and temperatures up to 280 deg. F, which made the molding equipment much more complicated and expensive.14

Although Duramold started as a civilian project, Clark almost immediately turned to the Army for development and production contracts. Clark, who had been chief engineer for Army aviation in World War I, promised the Army rapid production at low cost. In his correspondence with the Army in early 1938, Clark did his best to disassociate Duramold from wood. Duramold was based on wood, Clark admitted, but “we prefer, insofar as possible, to avoid the use of this word because of the unpleasant associations resulting from most unhappy experiences with ‘wooden’ airplanes in times past.” Instead, Clark attempted to link Duramold with plastics, which in the 1930s carried the aura of a progressive, science-based technology.15

The Army was not fooled. J. B. Johnson, the Army’s chief expert on airplane materials and a metallurgist by training, had no time for wood in any form. Duramold, insisted Johnson, was “simply” plywood glued with a synthetic adhesive.16 Johnson’s assessment of Duramold was shared by other engineers and officers at Wright Field, home of the Materiel Division, the Army Air Corps’ organization for aviation research, development, and procurement. Despite opposition from Wright Field, Clark was able to gamer some support from Army Air Corps officials in Washington, notably General H. H. Arnold, then assistant chief of the Air Corps. Nevertheless, in February 1938 the Secretary of War rejected a request to fund the development of Duramold and other “plastic” materials, arguing that “the present highly satisfactory all-metal airplane is the result of a long period of development at considerable expense. We should concentrate on the perfection of metal airplanes.”17 Clark never obtained an Army contract, and later left the Fairchild company to work with Howard Hughes on his large wooden flying boat.

These negotiations illustrate a struggle to define the symbolic meanings of “plastic” plywood. Clark sought to emphasize the symbolic link to plastics, a progressive technology ripe with manifold possibilities, while Johnson insisted on identifying Duramold with wood, a discredited material already rejected by the Army.18 Soon, however, interest in wood airplanes would be revived, not by its link with the modernity of plastics, but rather due to the threat of war.

More than anything else, it was the threat of war that revived American and European interest in wood airplanes. By itself, the technical promise of synthetic adhesives could not overcome the opposition rooted in wood’s symbolism as a traditional material. Proponents of synthetic adhesives did get some attention by invoking the symbolism of plastics, but this strategy could not prevent critics from pointing out that materials like Duramold consisted mainly of wood veneers. The prospect of war, however, brought problems of production to the foreground. Wood offered potential solutions to some of these problems, in particular shortages of metals, labor, and production facilities. Furthermore, the issue of production gave defenders of wood an opportunity to air a whole range of technical arguments concerning choice of materials.

Renewed interest in wood first emerged in Europe, where the growing threat of Nazi Germany was most keenly felt, especially after the Munich crisis of September 1938. In November 1938, the British journal Aeroplane published an article defending wood by F. G. Miles, a designer of small commercial airplanes and military trainers. Miles insisted that metal airplanes had not “not lived up to early expectations” for quantity production. Wood airplanes, he claimed, offered a number of advantages over metal in design and production. They could be designed more quickly, and they could take advantage of skilled labor in the wood-working trades. Miles predicted that costs would be lower and the supply of material greater. He insisted that, except for large aircraft, wood airplanes could meet the same demanding specifications as metal airplanes with regard to speed and durability. Similar arguments were presented in French and Dutch aviation journals.19

Beginning in 1939, the American aviation press also published a flurry of articles highlighting the new opportunities created by resin adhesives and plywood molding techniques. Most of these articles stressed advantages for war production, even before the German invasion of Poland. For example, in an article in the Scientific American, journalist Forest Davis pronounced molded plywood airplanes of “tremendous wartime significance.” Airplanes were “a machine-age paradox,” argued Davis, still largely made by hand while “automobiles roll off the assembly line like shelled peas into a basket.” Duramold provided the solution, making possible “a practically unlimited supply of stout, cheap, fast airplanes.”20 H. O. Basquin of Haskelite provided a similar but more sober assessment, pointing to the 170,000 workers in the furniture industry who could be shifted to wooden airplane production in wartime.21

Despite the interest in wood generated by the threat of war, proponents of wooden airplanes still had a long way to go to translate promise into practice. As Donald MacKenzie has pointed out, the inherent potential of a technology, which he terms the “intrinsic” properties, are ultimately irrelevant in choices between competing technologies. Most engineers and managers base their choices on extrinsic properties, that is, what the technology achieves in practice. But what a technology achieves in practice depends heavily on the resources devoted to its development. Beliefs about intrinsic properties can influence the allocation of resources to competing technologies, becoming in effect self-fulfilling prophecies, promoting the success of the technology that people believe has the most potential to succeed.22

Proponents of the new wooden airplanes understood this process. Through their interventions in the technical press, they hoped to convince the aeronautical community to devote its resources to solving the considerable development problems that stood between the promise and reality of wood construction. And the problems were indeed daunting. After more than a decade of neglect of wood, metal had a vast advantage in available design data, accumulated experience in manufacturing, and lessons learned from commercial and military service. Metal was in a similar position in the early 1920s, when wood framework structures were dominant. As with metal construction in the 1920s, only the military had the resources to compensate for this disadvantage.

ENGINE TESTING

Engine evaluation tends to focus on duct and compressor (turbine and nozzle) efficiencies, pressure ratios, turbine fluid dynamic flow resistance, rotational speed, engine air intake amounts. Typically one measures variables such as fuel flows, engine speeds, pressures, stresses, power, thrust, altitude, airspeed – and then calculates these other performance parameters through modeling of the data. The results usually are presented as dimensionless numbers characterizing inlet ducting, compressor air bleeding, exhaust ducting, etc.12

a. Engine Test Cells

There are two main types of engine test cells:

Static cells run heavily instrumented engines fixed to engine platforms under standard sea-level (“static”) conditions;

Altitude chambers run engines in simulated high-altitude situations, supplying “treated [intake] air at the correct temperature and pressure conditions for any selected altitude and forward speed the rest of the engine, including the exhaust or propelling nozzle, is subjected to a pressure corresponding to any selected altitude to at least 70,000 feet.”13

In earlier piston-engine trials an engine and cowling were run in a wind tunnel to test interactive effects between propeller and cowling. Wind tunnels specially adapted to exhaust jet blasts and heat sometimes are used to test jet engines.14

Test cells measure principal variables such as thrust, fuel consumption, rotational speed, and airflow. In addition much effort is directed at solving design problems such as “starting, ignition, acceleration, combustion hot spots, compressor surging, blade vibration, combustion blowout, nacelle cooling, anti-icing.”15

Test cell instrumentation followed flight-test instrumentation techniques, yet was a bit cruder since miniaturization, survival of high-G maneuvers, and lack of space for on-board observers were unimportant. Flight test centers usually had test cells as well, and performed both sorts of tests. Test cell and flight-test data typically were reduced and analyzed by the same people, and similar instrumentation was efficient. Thus test-cell instrumentation tended to imitate, with lag, innovations in flight test instrumentation. Here we only discuss instrumentation peculiar to test cells.

Test cell protocols involve less extreme performance transitions, and thus are more amenable to cruder recording forms such as observers reading gauges. The earliest test cells had a few pressure tubes connected to large mechanical gauges16 and volt-meter displayed thermal measurements. Thrust measurements were critical. Great ingenuity was expended in thrust instrumentation using “bell crank and weigh scales, hydraulic or pneumatic pistons, strain gauges or electric load cells.”17 Engine speed was the critical data-analysis reference variable, yet perhaps easiest to record since turbojets had auxiliary power take-offs that could be directly measured by tachometer.

By the late 1940s electrical pressure transducers were used to record pressures automatically. Since they were extremely expensive, single transducers would be connected to a scanivalve mechanism that briefly sampled sequentially the pressures on many different lines, with the values being recorded. The scanivalve in effect was an early electro-mechanical analog-to-digital converter,18 giving average readings for many channels rather than tracking any single channel through its variations. Data processing, however, remained essentially manual until the late 1950s.

ENGINE TESTING

Figure 3. Heavily-instrumented static engine test cell, 1950s, with many hoses leading off for pressure measurements. [NACA, as reprinted in Lancaster 1959, Plate 2,24b.]

Test cells operate engines in confined spaces, and engine/test chamber interactive effects often produce erroneous measurements. For example, flexible fuel and pressure lines (which stiffen under pressure) may contaminate thrust measurements. This can be countered by allowing little if any movement of the thrust stand – something possible only under certain thrust measurement procedures. Other potential thrust-measurement errors are:

• air flowing around the engine causing drag on the engine;

• large amounts of cooling air flowing around the engine in a test cell have momentum changes which influence measured thrust;

• if engine and cell-cooling air do not enter the test cell at right angles to the engine axis, an error in measured thrust occurs due to the momentum of entering air along the engine axis;

• pressure difference between fore and aft of the engine may combine with the measured thrust.19

These can be controlled by proper design of the test cell environment or by making corrections in the data analysis stage.

b. Engine Flight Testing

In the 1940s and early 1950s, photopanels were the primary means for automatic collection of engine flight-test data. Early photopanels were mere duplicates of the

ENGINE TESTING

test-pilot’s own panel. Later the panels became quite involved, having many gauges not on the pilot’s panel. Large panels had 75 or more instruments photographed sequentially by a 35 mm camera.

After the flight film would be processed. Then using microfilm readers data technicians would read off instrument values into records such as punched cards. Data reduction was done by other technicians using mechanical calculators such as a Friden or Monroe. On average, one multiplication per minute could be maintained.20 This and the need to hand record each measurement from each photopanel gauge placed severe limitations on the amount of data that could be processed and analyzed. Time lag from flight test to analyzed data often was weeks.

The development of electrical transducers such as strain gauges, capacitance or strain-gauge pressure transducers, and thermocouples enabled more efficient continuous recording of data. They could be hooked to galvanometers that turned tiny mirrors reflecting beams of light focused as points on moving photosensitive

ENGINE TESTING

Figure 5. Photopanel instrumentation for XP-63A Kingcobra flight tests at Muroc Airbase, 1944-45. Upper photo shows the photopanel camera assembly. Its lens faces the back of the instrument photopanel shooting through a hole towards a mirror reflecting instrument readings. The lower left picture is the photopanel proper, consisting of several pressure gauges, two meters, and a liquid ball compass. The camera shoots through the square hole below the center of the main cluster. The lower right picture shows the test pilot’s own instrument panel. [Young Collection.]

ENGINE TESTING

Figure 6. Human computer operation at NASA Dryden Center, 1949, shown with a mechanical calculator in the foreground. [NASA E49-54.]

paper, giving continuous analog strip recordings of traces. Mirrors attached to 12-24 miniaturized pressure manometer diaphragms also were used.21 Such oscillograph techniques for recording wave phenomena go back to the 19th century,22 but by the 1950s had evolved into miniaturized 50-channel recording oscillographs (see Figure 10). By 1958, GE Flight Test routinely would carry one or two 50-channel CEC recording oscillographs in its test airplanes.

With 50 channels of data, one had to carefully design the range of each trace and its zero-point to ensure that traces could be differentiated and accurate readings could be obtained. Fifty channels of data recorded as continuous signals on a 12” wide strip posed a serious challenge. A major task for the instrumentation engineer was working out efficient and unambiguous use of the 50 channel capacity. Instrumentation adjusted the range and zero-point of each galvanometer to conform to the instrumentation engineer’s plan.

Another aspect of the instrumentation engineer’s job was to design an instrumentation package allowing for efficient adjustment of galvanometer swing and zero point. This amounted to the design of specific Wheatstone Bridge circuits to control each galvanometer. The 1958 instrumentation of the GE F-104 #6742, designed by George Runner, had a family of individual control modules hand-wired on circuit boards with wire-wound potentiometers to adjust swing. (Zero point was adjusted mechanically on the galvanometer itself.) Each unit was inserted in an aluminum “U” channel machined in the GE machine shop, with plug units in the rear and switches and potentiometer adjustments in the front end of the “U”. These interchangeable modules could be plugged into bays for 50 such units, allowing for

ENGINE TESTING

Подпись: Figure 8. GE data reduction and processing equipment, 1960. Three instrument clusters are shown. In the middle is a digitizing table for converting analogue oscillograph traces to digital data. A push of a button sends out digital values for the trace which are typed on a modified IBM typewriter to the left. The right cluster is a IBM card-reader/punch attached to a teletype unit mounted on the wall for transmitting data to and from the GE Evandale, Ohio, IBM 7090. On the left another IBM card reader is attached to an X-Y plotter. Various performance characteristics could then be plotted. [Suppe collection.]

Figure 7. Typical Oscillograph trace record; only 16 traces are shown compared to the 50 channel version often used in flight test. [Source: Bethwaite l%3. p. 232; background and traces have been inverted.)

speedy and efficient remodeling of the instrumentation. A basic fact of flight test is that each flight involves changes in instrumentation, and 742’s instrumentation was impressively flexible for the time. 100 channels of data could be regulated; two recording oscillographs were used.

Oscillograph traces are, of course, analog. By the latter 1950s data analysis was being done by digital computer. This meant that oscillograph traces had to be digitized. Initially it was done by hand. Later special digitizing tables let operators place cross-hairs over a trace and push a button sending digital coordinates to some output device. At GE Flight Test initially a modified IBM Executive typewriter would print out four digits then tab to the next position. Later output was to IBM cards.23 Typewriter output only allowed hand-plotting data, whereas IBM cards allowed input into tabulation and computer processing.

GE Flight Test-Edwards did not have its own computer facilities in the late 1950s and early 1960s. Some data reduction used computers leased from NASA/Dryden, which only ran one shift at the time. Sixteen hours a day, GE leased the NASA computer resources – initially an IBM 650 rotating drum machine, later replaced by an IBM 704 and then by an IBM 709 in 1962. Most data reduction was done, however, on the GE IBM 7090 in Evandale, Ohio. Sixteen hours a day, IBM cards were fed into a card-reader and teletyped to Evandale where they were duplicated and then fed into a data reduction program on the 7090; the output cards then were teletyped back to GE-Edwards for analysis and plotting. Much plotting was done by an automated plotter placing about 8 ink-dots per IBM card.

Electronic collection of data with computerized data reduction and analysis radically increased the amount of data that could be collected, processed, and interpreted. Numbers of measurements taken increased at the rate of growing computing power – doubling about every 18 months. The very same computerized data collection and processing capabilities were incorporated into sophisticated control systems for advanced aircraft such as the X-15 rocket research vehicle, the XB-70 mach 3 bomber, and the later Blackbird fighters. As aircraft and engine

ENGINE TESTING

Figure 9. As aircraft got faster they relied increasingly on computerized control systems. Left – hand chart shows the increase in maximum speed between 1940-1965. The right-hand diagram shows the increase in flight-test data channels for the same aircraft over the same period. [Source: Fig. 1, p. 241, and Fig. 4, p. 243, of Mellinger 1963.]

ENGINE TESTING

Figure 10. EDP unit installed at GE Flight Test, Edwards AFB, 1960. The rear wall contains two 2" digital tape units, amplifiers, and other rack-mounted components. A card-punching output unit is off the right. The horseshoe contains various modifiers, the left side for filtering analog data signals and the right for analog-to-digital conversion, scaling, and the like. At the ends of the horseshoe are a 51 channel oscillograph (left) and pen-plotter (right) for displaying samples of EDP processing outputs for analysis. [Suppe collection.]

control systems themselves became more computerized and dependent on ever­more sensors, engine flight test likewise had to sophisticate and collect more channels of data. Fifty channels was the upper limit of what could reliably be distinguished in 12” oscillograph film, and analyzing data from two oscillograph rolls per flight stretched the limits of manual data processing.

The only hope was digital data collection and processing. When data are recorded digitally, many inputs can be multiplexed onto the same channel. Multiplexing is a digital analog to use of a scanivalve that avoids problems of overlapping and ambiguous oscillograph traces by digital separation of individual variables. A further advantage of digital processing is that the data are in forms suitable for direct computer processing, thereby eliminating the human coding step in the digitization process.

GE got the contract to develop the J-93 engine for the B-70 mach 3 bomber. Instrumentation on this plane was unprecedented, exceeding its North American predecessor, the X-15. GE geared up for the XB-70 project, building a new mammoth test cell for the J-93 in 1959-60 with unusually extensive instrumentation (e. g, 50-100 pressure lines alone), introducing pulse-coded-modulation digital airborne tape data recording, developing telemetering capabilities, and contracting for a half-million dollar Electronic Data Processing (EDP) unit.

The EDP unit primarily was a “modifier” in the instrumentation scheme, filtering signals through analog plug-in filters, doing analog-to-digital conversions, and performing simple scalings. Data recorded on one 2” digital tape could be converted into another format (2” tape or punched card) suitable for direct use on the IBM 704,

ENGINE TESTING

Figure 11. Upper picture is the X-l 5 telemetry ground station ca. 1959. The bulk of the station is devoted to radar ground tracking of the X-l5. Only the recorder, plotter and bank with meters in the left portion are concerned with flight-test instrumentation. Lower picture is the Edwards AFB Flight Test Center telemetry ground station in the early 1990s. Computerized terminals and projected displays provide more extensive graphical analysis of performance data in real time. [Upper photo: Sanderson 1965, Fig. 19, p. 285; lower photo: Edwards AFB Flight Test Center.]

709, and 7090. It also had limited output transducers that produced strip or oscillograph images for preliminary analysis. The surprising thing about this huge EDP unit is that it had no computer – not if we make having non-tape “core” memory the minimal criterion for being a computer. The decision was to build this device for data reduction, then “ship” the data via teletype to GE-Evandale for detailed processing and analysis.

In telemetry signals collected by transducers are radioed to the ground, as well as sent to on-board recorders, where a ground station converts them to real-time displays – originally dials, meters, and X-Y pen plotters, but today computerized displays, sometimes projected on large screens in flight-test “command centers.” Test flights are very expensive, so project engineers monitor telemetered data and may opt to modify test protocols mid-flight.24 Telemetry provides the only data when a test aircraft crashes, destroying critical on-board data records. GE Flight Test developed telemetering capabilities in preparation for the XB-70 project, trying them out in initial X-15 flights.

The X-15 instrumentation was a trial run for the XB-70 project (both were built by North American), although the X-15 relied primarily on oscillographs for recording its 750 channels of data.25 With the XB-70 project, the transition from hand-recorded and analyzed data to automated data collection, reduction, and analysis is completed. The XB-70B instrumentation had about 1200 channels of data recorded on airborne digital tape units. Data reduction and processing were automated. Telemetry allowed project engineers to view performance data in real time and modify their test protocols. Subsequent developments would sophisticate, miniaturize, and enhance such flight-test procedures while accommodating increasing numbers of channels of data but do not significantly change the basic approach to flight test instrumentation and data analysis.

A supersonic test-bed was needed for flight test of the XB-70’s J-93 engines. Since the J-93 was roughly 6’ in diameter – larger than any prior jet engine – no

ENGINE TESTING

Figure 12.7 Modified supersonic B-58 for flight testing the J-93 engine that would power the XB-70 Mach 3 supersonic bomber. A J-93 engine pod has been added to the underbelly of the airframe. [Suppe collection.]

established airframe could use the engine without modification. GE acquired a B-58 supersonic bomber which it modified by placing a J-93 engine pod slung under the belly. Once the aircraft was airborne the J-93 test engine would take over and be evaluated under a range of performance scenarios.

The Aft Fan Component

The aft fan required the mechanical design of a new type of blading, with relatively high temperature turbine blades – or, as GE called them, turbine buckets – in the inner portion and relatively cold fan blades of the opposite camber in the outer portion; GE dubbed these blades “bluckets” (see Figure 10). The aerodynamic

The Aft Fan Component

Figure 9. John Blanton, Richard Novak, Linwood Wright, key contributors to General Electric’s aft-fan development.

design of the turbine blading fell within the state of the art, whether the fan component consisted of one stage or two. But the same was not true of the fan blading. Considerations of weight and simplicity strongly favored a single stage fan. As is always the case, the thermodynamic cycle design of the fan component in­volved a complex set of trade-offs. The CJ805 turbojet produced 11,000 pounds of take-off thrust at a specific fuel consumption – i. e. pounds of fuel per hour per pound of thrust – around 0.70. Blanton found that a 1.56 bypass ratio aft fan behind the CJ805 could increase the take-off thrust to 15,000 pounds at a specific fuel consumption as low as 0.55, a quantum jump in both parameters! The one issue was the thrust-to-weight ratio of the engine, which depended on the weight of the fan component. The fan would have to pass 250 lbs/sec of air at a pressure-ratio of 1.6 with an installed efficiency no less than 0.82. Could this be achieved in a single stage? It was far beyond any single compressor stage GE had ever designed before, or for that matter any stage that had ever been in flight. Wright was nevertheless insistent that it could be done.54

The detailed aerodynamic design of the fan was predicated on two crucial decisions. The first was to set the tip Mach number of the fan at 1.25. Klapproth’s 1400 ft/sec tip-speed design had shown that the losses in appropriately designed blading correlated continuously with those in conventional blading up to a Mach number of 1.35. Wright’s 1260 ft/sec transonic rotor, which had a design tip Mach number of 1.25, had been predicated on the 90 percent speed results of Klapproth’s design.55 In effect, based on his experience at NACA, Wright decided that losses associated with shocks would not become obtrusive so long as the tip Mach number did not exceed 1.25. His high confidence in the design, which was questioned by several of GE’s experienced compressor designers, came in large part from the safety margin he believed he had introduced in choosing the 1.25 tip Mach number.

Fan Aerodynamic Design-A New Computer Method The second crucial decision was to adopt a novel analytical design approach. A distinctive feature of both Klapproth’s 1400 ft/sec and Wright’s 1260 ft/sec NACA

The Aft Fan Component

Figure 10. Blucket from General Electric CJ805-23 fan engine. Inner section is turbine “bucket,” drawing energy from jet exhaust, outer section is fan blade, pressurizing bypass flow, hence the hybrid term “blucket.” [Wilkinson, cited in text, p. 32.]

rotors “was a fairly elaborate three-dimensional design system which allows both arbitrary radial and axial work distributions”56 within the blade row. Just as the annulus or flow area must contract in a high-pressure-ratio, multistage compressor, the flow area within a high-pressure-ratio blade row must contract between the leading and trailing edges far more than in conventional blade rows. Furthermore, high Mach number airfoil profiles are very sensitive to incidence angle. As a conse­quence, radial equilibrium effects, redistributing the flow radially, becomes important within blade rows in this type of stage, and not just from stage to stage as in more conventional compressors.

One of the first computer programs GE had developed after delivery of its IBM – 704 digital computer in 1955 solved the radial equilibrium problem in multistage axial compressors. The program employed the so-called streamline-curvature method, an iterative procedure for solving the inviscid flow equations. Specifically, an initial guess is made on where the streamlines lie radially in the spaces between each blade row throughout the compressor, and the flow along these streamlines is calculated; the streamlines are then relocated iteratively until the continuity equation is satisfied.57 When used in design, the work done and losses incurred across each blade row are specified as input along the streamlines, and the flow analysis results are then used to select appropriate standard airfoil profiles for the blades.58 Such an iterative approach was out of the question without digital computers, for the total number of calculations required is immense. Even with an IBM-704, the solution for a single operating point of the 17-stage J-79 compressor would take two or three hours, depending on the initial streamline location guess. The advance in analytical capability, however, justified this. The radial redistribution of the flow throughout a multistage compressor could be calculated with reasonable confidence for both design and off-design operating conditions. Streamline-curvature computer programs revolutionized the analytical design of axial compressors.59

Novak’s strong advocacy of streamline-curvature methods had been one of the chief reasons GE had developed this program in the first place. In the original program radial equilibrium was imposed only in the open spaces on either side of each blade row. Novak now proposed that GE’s streamline curvature program be specially modified to allow radial equilibrium to be imposed at select stations within blade rows. The streamlines and calculation stations for the fan are shown in Figure 11. In effect, the modified procedure “fools the IBM computer into thinking it is going through a series of stators with no swirl in the inlet of the compressor, through a series of rotors with small energy input through the rotor proper, and a series of stationary blade rows when it actually computes through the complete stator.”60 The second key decision in the design of the fan was to modify the streamline-curvature computer program and use it in designing the rotor and stator airfoils.

The Aft Fan Component

Figure 11. Schematic illustration of streamline curvature method used in fan design (looking sideways at the engine). Initial positions of “streamlines” are assumed, flow conditions are then computed at each of the numbered stations; streamlines are then iteratively relocated until continuity conditions are satisfied. The unusual feature in this diagram is that computational stages aie included within each blade row (i. e. stations 4, 5, 6 & 7 are within rotor). [Wright and Novak, op. cit., p. 5; Figures 11-17 are all from this paper, cited in note 7 of the text.]

Specifically, the following parameters were specified as input and the requisite shape of the airfoils was inferred from the flow solution: (1) loss or entropy change distributions, both radially and along stream surfaces through the blades and annulus; (2) energy or work distribution radially and along stream surfaces; (3) blade blockage – i. e., a reduction in flow area within the blade rows; and (4) an allowance for boundary layer thickness along the casing wall. The solution determined (circumferentially average) velocities and pressures at each station along the streamlines. Blade surface velocities could then be inferred by assuming a linear cross-channel variation in static pressure; and blade contours were inferred from the (circumferentially average) relative flow angles at each station by assuming a blade thickness distribution and a distribution of the difference between air and metal angles within the blade row.

The choice dictating the values of the aforementioned parameters is based on judgment, prior test data and on a knowledge of the probable mechanical re­quirements of blade-thickness distribution, and so on…. It is to be recognized from the start that the entire procedure presupposes an iteration, with many variables, to a selfconsistent solution. Hence, each input parameter itself was considered as subject to change.61

No cascade airfoil contours had ever been designed by means of such an elaborate procedure before. The “Arbitrary Blade Contour” Program, as Wright called the modified program, gave him good design control in a design that stood well outside the established state of the art.62

Its complexity and sophistication notwithstanding, this analytical method fell far short of providing a scientifically rigorous or exact calculation of the flow in the fan. First of all, the program was solving the inviscid equations of motion, with viscous losses simply estimated and superposed numerically at calculation stations. In particular, the viscous boundary layers on the blade sur­faces were ignored, their effects represented by superposing on the inviscid flow a stipulated sequence of thermodynamic losses distributed linearly with axial distance.63

Second, the actual rotor blades and stator vanes indicated in Figure 11 were not literally included in the analysis. The streamlines shown in the figure were really axisymmetric stream surfaces in the calculation – not just between blade rows, but within them as well. The physical presence of the blades was represented by a numerically superposed blockage of the flow within the blade rows. The velocities and pressure calculated at each axial station within a blade row were accordingly treated within the analysis as if they were uniform around the circumference. The velocities at the blade surfaces were then calculated, in a subsidiary program, by stipulating the number of blades and assuming a linear variation in pressure from one blade surface to the next. The method thus replaced the actual three-dimensional geometry and flow by a highly idealized model; it did not include even a two­dimensional blade-to-blade flow solution of the sort that had been promoted by Chung-Hua Wu at NACA.64

Third, no effort was made to determine the precise locations of the shocks, much less to determine their interaction with airfoil boundary layers. The American Society of Mechanical Engineers’ paper by Wright and Novak describing the design of the fan and the method followed never mentions shocks. Yet shocks were surely present, for the design relative incident velocity was supersonic over all but a small fraction of the blade span, ranging from a Mach number of 1.25 at the tip to 0.98 at the hub. The shocks were taken into account only in the input distributions of losses and work specified within the rotor blade row; the shock structure assumed for this purpose was based on two-dimensional Schlieren photographs of the sort shown in Figure 8.

In short, what the analytical method did was to provide a highly idealized analysis of radial equilibrium effects within the blade rows. High Mach number blading is sensitive to deviations in incidence angles. The principal source of such deviations was thought to be radial migration of streamlines within the blade rows and blockage caused by the casing wall boundary layers. The method yielded blade contours in which radial equilibrium effects within the blade rows were consistent, under the assumptions of the analysis, with the computed incidence angles. The inputs assumed in the design were based on judgment and previous test data, reflecting Wright’s experience at NACA. A large number of passes through the design procedure (each requiring more than 20 minutes of IBM 704 computer time) were made, with these inputs changing, before a result emerged that was deemed adequately “selfconsistent.” The analytical method, for all its sophistication, was a tool in a design that remained essentially a product of judgment.

A central element of this judgment was to maintain the diffusion factors across the blade rows within the established limits, subject to Klapproth’s proviso (quoted earlier) that the velocity distributions within the blade rows not depart too radically from those of conventional airfoils. The computer program served to define the radial relocation of the stream surfaces within the blade rows, across which the diffusion factor was calculated, and it helped assure that the design would fall within the regime Klapproth had singled out. How much the blades designed on the basis of it differed from blades that might have been obtained, exercising the same judgment, from the computationally less intensive methods followed by Klapproth and Wright at NACA is an open question.65

ALUMINUM SHORTAGES AND WORLD WAR II: AIR FORCES EMBRACE WOOD

Despite the arguments advanced by proponents of wood, the mere threat of war did little to stimulate renewed development of wooden airplanes by potential belligerents. Germany, the main source of renewed military tensions, showed little interest in wooden airplanes. The expansion of the German air force, begun soon after the Nazi seizure of power, was also accompanied by a huge expansion of Germany’s aluminum capacity; by 1939 Germany had surpassed the United States and become the largest aluminum producer in the world. This expansion was dictated more by National Socialist Autarkiepolitik than by projected needs of the Luftwaffe, but this vast capacity no doubt dampened German interest in developing wooden airplanes.23

The raw material situation was quite different in Britain, where serious rearmament began in 1936. The expansion of the RAF occurred simultaneously with the shift to aluminum stressed-skin construction, yet British aluminum production in 1939 amount to only 15 percent of Germany’s. British strategy was to rely on Canadian and American production to supply its needs. Already in April 1939, the British Air Ministry estimated that imports would have to supply two – thirds of British requirements; these estimates proved low.24 Although the Air Ministry appeared confident of its ability to obtain the necessary aluminum supplies, this dependence apparently made the British more willing to continue the use of wood in non-combat airplanes, primarily trainers. In the late 1930s, the RAF stepped up purchases of wooden training aircraft, and by 1943 all British-made training aircraft in production used all-wood or wooden-winged construction.25

Yet Britain’s use of wood was not confined to non-combat aircraft, due largely to the efforts of a single major British aviation firm, the De Havilland Aircraft Company. This firm designed the most famous wooden airplane of the war, the de Havilland Mosquito, a twin-engine bomber, fighter-bomber, night fighter and reconnaissance airplane. The Mosquito was conceived by the de Havilland firm shortly after the Munich crisis in 1938. Geoffrey de Havilland, the company’s founder, proposed building a fast unarmed bomber, protected only by its speed and maneuverability. The de Havilland design dispensed with the anti-aircraft guns standard for bombers at the time. Without defensive armament, claimed de Havilland, his design would fly faster than the opposing fighters. He also noted the advantages of wood for production in wartime, when it would not compete for resources with the metal-using industries. The de Havilland proposal was presented to the Air Ministry in October 1938, but the unconventional design generated little interest. After the declaration of war the following September, the de Havilland firm pressed its case for the design before the Air Ministry, and in December de Havilland received an order for the Mosquito prototype. The Mosquito first flew in November 1940, a mere 11 months after serious design work began. Performance exceeded expectations, and the Air Ministry placed large production orders for the airplane.26

Production deliveries began in July 1941. The airplane soon proved itself in combat, becoming “one of the most outstandingly successful products of the British aircraft industry during the Second World War.” The Mosquito excelled in speed, range, ceiling and maneuverability, making it useful in a variety of roles. Even before the prototype flew, De Havilland began developing reconnaissance and night-fighter variants.27 With a range of over 2000 miles, the original reconnaissance version could photograph most of Europe from bases in Britain at a height and speed that made it practically immune to enemy attack. Later modifications extended the range of the reconnaissance version to over 3500 miles.28 Studies of the Allied air offensive against Germany showed the Mosquito to be far more efficient at placing bombs on target than the large all-metal bombers that formed the backbone of the bombing campaigns. Compared to the heavy bombers, the Mosquito was cheaper to build, required a much smaller crew, and suffered a much lower loss rate, only two percent for the Mosquito compared to five percent for the heavy bombers. One British study calculated that the Mosquito required less than a quarter of the investment to deliver the same weight of bombs as the Lancaster, the main British four-engine bomber.29

The Canadians also got involved in wooden aircraft production. The Canadian case is particularly instructive because of its similarity with the United States in technology and availability of materials. During the interwar period, Canada had built up a small aircraft industry, though its design capabilities remained limited. For armaments, Canada remained largely dependent on Britain, and the Canadian armed forces followed other Commonwealth countries in standardizing on British materiel. As the British rearmed in the late 1930s, they looked to Canada as a possible source of aircraft and munitions, in addition to Canada’s traditional role as a supplier of raw materials. The Canadians, however, were loathe to finance expansion of their production capacity without guaranteed orders from Britain. In November 1938, the British finally placed a significant order with the Canadian aircraft industry for 80 Hampden bombers and 40 Hurricane fighters, accepting a 25 percent higher cost as the price for creating additional aircraft capacity.30

Canada remained a reluctant ally even after joining Britain in declaring war on Germany. Nevertheless, Canada did agree to host the British Commonwealth Air Training Plan, an ambitious program that eventually provided nearly 138,000 pilots and other air personnel for the British war effort. This program would require an estimated 5,000 training airplanes. The Canadian subsidiary of De Havilland was already producing the Tiger Moth, an elementary biplane trainer of wood construction that would be used for the training program. But Britain discouraged Canadian production of the more sophisticated training airplanes, insisting instead on supplying these types from their own production or American purchases.31

This situation changed radically with the fall of France. In the bleak summer of 1940 a British defeat seemed a very real possibility. Britain cut off shipments of aircraft and parts to Canada, and no replacements seemed likely from the U. S. for quite some time. It appeared that Canada might be forced to depend on its own resources for defense.32

One key Canadian resource was timber. In a report dated May 1940, J. H. Parkin proposed a program for developing wooden military airplanes in Canada. Parkin, director of the Aeronautical Laboratories at the National Research Council (NRC), presented strong technical arguments in favor of wood structures. Parkin also stressed Canada’s large timber resources, which included large reserves of virgin Sitka spruce. Parkin proposed that “the design and construction of military aircraft fabricated of wood should be initiated in Canada immediately.”33

These proposals helped launch a major Canadian program for producing wooden airplanes. Air Vice-Marshall E. W. Stedman, the chief technical officer in the RCAF, strongly advocated the construction of wooden airplanes. In London, the Ministry of Aircraft Production sought to discourage “inexperienced Canadian designers” from developing their own airplanes. Nevertheless, the RCAF continued to urge production of a wooden combat airplane in Canada; these efforts eventually led to Canadian production of the Mosquito.34 De Havilland Canada built a plant with a mechanized assembly line for Mosquito production; this plant reached a production rate of 85 airplanes monthly by mid-1945.35

Despite British skepticism, the Canadian government strongly supported the development of innovative wooden airplanes of Canadian design. In coordination with the RCAF, the NRC launched a substantial research program to develop molded plywood construction. In July 1940 RCAF and NRC staff traveled to the U. S. to investigate the latest techniques in wooden aircraft construction. They were especially impressed with Eugene Vidal’s process. Vidal was former Director of Civil Aeronautics at the Commerce Department and an enthusiast of the “personal” airplane. Vidal had started research on molded plywood after his unsuccessful attempt to develop a $700 all-metal airplane while at the Commerce Department.36

By the fall of 1940, Vidal had become the leading American developer of plywood molding techniques, due to Clark’s failure to secure military support for Duramold.37 The Canadian government asked Vidal’s company to build an experimental fuselage for the Anson twin-engine training plane, a British design then being built in Canada. The fuselage was a success, and in 1943 a Canadian company began manufacturing the fuselages under license to Vidal. From 1943 to 1945 over 1000 of the Vidal Ansons were built in Canada. A rugged, reliable airplane, the Vidal Ansons found wide use as civil aircraft after the war. The Vidal Ansons provided one of the largest and most successful applications of molded plywood to airplane structures during the war.38

The United States also launched a major wooden airplane program during World War II, but not until severe aluminum shortages threatened to curtail aircraft production. But unlike the British and Canadians, American support for wooden airplanes remained highly ambivalent.

American rearmament did not begin in earnest until after the German invasion of the low countries in May 1940, when President Franklin Roosevelt startled Congress with his 50,000-airplane program, which called for roughly a ten-fold increase over current production. Before FDR’s dramatic announcement, military planners had repeatedly insisted that aluminum supplies were ample to meet any emergency. Although Air Corps planners had given some attention to increasing the capacity of airplane plants, they had “virtually ignored” possible shortages of aircraft materials and accessories. Conditioned by interwar parsimony, the planners had little inkling of the numbers of airplanes that the President and armed forces would demand, especially when the U. S. became involved in a shooting war.39

American aircraft manufactures began publicly reporting serious aluminum shortages in late 1940 as production accelerated to meet British as well as American needs. In early 1941, the U. S. Office of Production Management finally acknowledged that the country was facing a serious aluminum shortage, and began restricting civilian consumption of aluminum. The federal government responded by financing a massive increase in aluminum refining capacity.40 But in the meantime the military would have to find other materials if it hoped to meet the President’s production goals.

With the onset of the aluminum shortage in early 1941, the Army rushed to expand the use of wood in non-combat airplanes. Early in the year, Wright Field began asking some of the Army’s largest suppliers to establish programs for converting aluminum airplane parts to plywood or plastics, and by the mid-1941 these programs were well under way. North American Aviation had an especially active substitution program for the AT-6, the most widely used advanced trainer in the war. Three major manufacturers were developing all-wood bombing trainers for the Army; two of them, Beech and Fairchild, received production contracts before the end of the year. The Air Corps also accelerated orders for its wood primary trainers already in production; by August 1941 Fairchild was building four PT-19 trainers a day. Cessna began building a twin-engine trainer for the Army based on its commercial light transport. Wooden airplanes appeared poised to play a major role in American mobilization.41

Plans for wooden airplanes grew even more ambitious after Pearl Harbor. By March 1942, Wright Field had plans to order some 16,000 wooden airplanes,

28.0 wooden propellers and 3,000 wooden gliders. Wright Field staff estimated that the substitution program would save some 45 million pounds of aluminum in the production of existing airplanes, largely by using plywood for non-structural parts. The Army Air Forces also ordered 400 Fairchild AT-13s, a new all-wood crew trainer, a fivefold increase over the original order. In an even more ambitious project, the Army launched plans for quantity production of a large wooden transport to be developed by Curtiss-Wright, the C-76. By December 1942 Curtiss-Wright had received orders for 2600 C-76 airplanes at a total estimated cost of over $400 million, including the construction of two huge new factories.42

At first glance, the American wooden airplane program appears almost as successful as those of Britain and Canada. The Army and Navy purchased some

27.0 airplanes that used wood for a significant part of the structure, along with nearly 16,000 gliders built largely of wood. These figures imply that wood airplanes made a significant contribution to the U. S. war effort, amounting to some 9 percent of the 300,000 airplanes produced for the military from July 1, 1940 to Aug. 30, 1945 43 But a closer look reveals this contribution to be less than it seems. With one exception, none of these wooden types were for combat, and the one combat airplane never entered production. The vast majority were relatively light-weight, low-performance training airplanes, mostly based on designs from the 1930s that did not take advantage of synthetic adhesives or molding techniques. In terms of airframe weight, a more reliable index of manufacturing effort, wooden airplanes accounted for only about 2.5 percent of the total44 Furthermore, most of the models produced in quantity used wood for just a small part of the total structure, such as the wing spars.

When it came to developing new designs, the American wooden airplane program was almost a complete failure. Problems occurred in design, production and maintenance. One of the most disastrous design failures was the Curtiss-Wright C – 76, a large twin-engine transport designed to carry a 4500-pound payload. Curtiss-Wright was one of the Army’s leading suppliers, but it had no recent experience designing wooden airplanes. The project began in March 1942 with an order for 200 airplanes; the Army ordered an additional 2400 before the first prototype was completed. When the C-76 prototype was finished a mere 11 months later, it proved overweight, under strength, and difficult to control in flight. In June 1943, repeated failures in static tests led Wright Field to reduce the permissible gross weight to 26,500 pounds pending successful strengthening of the structure, leaving the airplane with a pitiful payload of 549 pounds. The project became the subject of a Congressional investigation, and in July Gen. H. H. Arnold canceled the project at a loss to the Army of $40 million 45

By the summer of 1943, aluminum had become plentiful in the United States, and Wright Field began canceling production of wood designs in favor of proven metal models. In September, J. B. Johnson reported to a NACA committee that the Army was “discouraging the use of wood construction” due to “disappointing results” with wood airplanes.46 The Army also cut off funding for wood research being conducted at the Forest Products Laboratory in Madison, Wisconsin.47 The momentum of some projects carried them forward for almost another year, but in time they too were canceled. Howard Hughes was able to continue working on his giant flying boat despite military opposition, since his funding came from the Defense Plant Corporation rather than the military. But Hughes was engaged in an act of technological hubris that was bound to fail, despite the tremendous technical skill that he brought to the project.48

AIRFRAME TESTING

Airframe performance ultimately is a function of forces, moments, and pressures produced as the aircraft moves through the air. The six most fundamental dimensions are lift, drag, side force, and moments around the three axes of rotation – pitch, roll, and yaw.26 These contribute to, but do not fully determine performance, handling qualities, stability, and control including stall and spin behavior. In development of an aircraft design, modifications may be made to improve these characteristics, reduce drag, improve structural loadings, or modify systems operations.27 One function of flight test is to reveal prototype design limitations or flaws so that they can be corrected prior to production.

Wind tunnels give essential information about the six fundamental performance dimensions. Their ability to reveal handling characteristics are limited to what can be learned by flying tethered powered models in the tunnel.28 Flight test is required to put the airframe through its full paces and reveal design problems and weaknesses.

Flight testing typically begins with taxi tests, followed by lift-offs to no more than half the wingspan before settling down to assess handling characteristics at crucial take-off and landing transitions where the plane is held aloft by ground effect while below stall speed. Finally take-off is attempted, leading to a succession of flights performing the panoply of test protocols.29

a. Wind Tunnels

There are three main types of wind tunnels: Low speed or subsonic, transonic, and supersonic. The latter two types essentially are modifications of basic low-speed tunnel design and techniques. Although NACA Langley inaugurated a full-sized wind tunnel in 1929,30 wind tunnels typically insert scale models of aircraft into a fast-moving streams of air and take measurements of the six fundamental dimensions and of pressures at various airframe surface locations.

Wind tunnel tests are valuable because (i) “there is absolutely no difference traceable to having the [airframe] model still and the air moving instead of vice versa”31 and (ii) the data collected can be converted into “nondimensional coefficients that have meaning with regard to the full-scale aircraft” despite the fact that the actual “forces and moments measured on a scaled model in a wind tunnel will be considerably different from those of an aircraft in flight.”32 When the equations governing a model can be put in dimensionless form – as can the Navier Stokes equation governing wind tunnels – the observations are scale invariant and can be applied to different-scaled phenomena.33

AIRFRAME TESTING

Figure 13. The Glenn L. Martin Wind Tunnel (GLMWT) facility at the University of Maryland, College Park, was a state-of-the – art facility in 1949. Aircraft developed there include the Lockheed Cl30 Hercules and Jet Star, MacDonnell F101 Voodoo, Vaught F-8 Crusader, and the basic dual rotor design for the Boeing helicopters. Today Ford Motor Company wind tunnel testing is done there. Upper diagram shows the basic facility with workshops, wind source, and the beam balance mechanisms. Test area and control center are located on the upper story. The lower figure shows the basic single return tunnel design. Note the vanes that deflect the air around corners, the narrowing of the test section or “jet” preceded by a settling chamber and entrance cone and followed by a breather and then a diffuser region. [GLMWT]

AIRFRAME TESTINGFigure 14: GLMWT wind source, a B-29 propeller connected to a 4,300 volt electric motor, achieves wind speeds of up to 235 mph (200 knots). Below, a scale model is attached to a pylon connected to a balance platform. In the foreground is an array of manometer tubes used to measure pressures at various points on the model’s airfoil surface. [GLMWT]

AIRFRAME TESTING

AIRFRAME TESTING

Figure 15, Typical turntable ami balance mechanism tor measuring six Fundamental performance dimensions. The scale model attached to the balance turntable (above). For given orientation oFthe plane to the wind, lift, drag, etc* Forces arc created moving the balance turntable and the pitch arm. Those movements are transferred via mechanical linkages to six different beam balances (below).


AIRFRAME TESTINGThe balances are labeled as follows: Roll; Drag; Yaw moment; Pitch moment; Side Force. Rolling moment, being a Function of differential lift on the two wings, is calculated From the lift. [Rae and Pope 1984, Figures 4.2, 4.3.]

Giant propellers accelerate air movement directed at instrumented test models. In typical subsonic configurations, the model is attached to pylons connected to a balance turntable. Mechanical linkages connect turntable movements to separate beam balances that record each of the six fundamental performance dimensions. Each beam balance is similar to those found at a doctor’s office, although automated. In the original 1949 Glenn L. Martin Wind Tunnel (GLMWT) configuration, the weight was on a threaded screw, and a set of contacts off the wing end of the balance send signals causing the weight to move towards a limit cycle about the balance point. A Selsen servo transmitter connected to the screw counted revolutions. Its output was sent to a Selsen receiver driving a rotary switch giving digital readouts to six significant digits. If loads exceeded what the traveling weight could balance, a cam device automatically added weights to the end of the beam and adjusted the Selsen output. Digital outputs were fed to control panel displays and IBM card punch and gang printer. Measurement accuracy was one part in 100,000. Today the Selsen units have been replaced by links from the beam balances to digital readout laboratory scales. Accuracy is unchanged.

AIRFRAME TESTING

Figure 16. 1949 view of GLMWT beam balance mechanism beneath the test chamber turntable seen at top. One of six beam balances mechanisms is shown at the right middle. The light-colored rectangular object is the balance weight mounted on a rotating screw. [GLMWT]

AIRFRAME TESTING

Figure 17. Data gathering during a GLMWT run, ca. 1949. Operator regulates the wind speed from the control console. Two sets of backlit 200 tube manometers are connected to hoses coming from orifices in the model surface. A bundle of hoses leading to the taller set of manometers (right) can be seen directly above the standing man with clip board. Camera placed in front of the right manometer set records readings. [GLMWT]

Pressure measurements are made at various places along wing and fuselage. 200 tube manometers connected by hoses to openings on the model’s surface were used at GLMWT. Suitably configured, the adjacent manometer tubes created performance “curves” that could be photographed for more detailed analysis. By the 1960s strain-gauge pressure transducers replaced the manometers. They were so expensive that one was connected to a 48 channel scanivalve. Oscillographs were experimented with, but were not very usable except for dynamic load displacement experiments because they have too high a frequency response and most of what was recorded was noise. Wind tunnel measurements are average values, and readings need to be passed through low-pass filters to eliminate noise. To filter oscillograph data required excessive data processing. Similar problems were experienced when digital tape recorders were tried. The most efficient and reliable way to obtain average values was for tunnel technicians to eyeball meter or digital outputs and record the average value. Only about 8 readings per second are required.

Data processing in 1949 consisted in draftsmen plotting data off digital read-out displays during runs and a bevy of ten women “computers.” Early attempts were made to use IBM card tabulating equipment for data processing, but proved inferior

AIRFRAME TESTING

Figure 18. Pressure hoses suitably connected to a bank at’ manometers produce graphic data displays that were photographed—here measurements taken from a wake-survey rake located att of the model. On the left there is zero lift and the hump is proportional to airfoil drag* On the right the airflowr is laminar, producing lift, and drag is reduced. [NACA Langley; as reproduced Baals and Corliss I98L p. 4L}

AIRFRAME TESTING

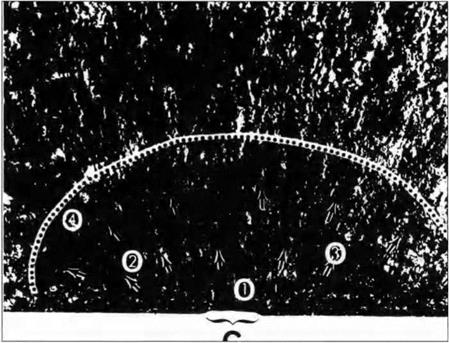
Figure 19. A model has been coated with oil applied in strips prior to turning on the wind. Observation of oil flow migration patterns reveals specific surface flow patterns. [GLMWT]

Figure 20. Two means оГdigital data read-out of the six fundamental measurements plus wind speed, ca 1949: An IBM gang primer (right) and digital readout (left) where six rows of ten lighted numbers would give digital readouts of each of the seven measurements. Since average values were desired, one could lock – in a value for recording by use oflhc banks of push buttons below the displays. An IBM card punch (not shown) records data on IBM cards for computer processing. Detail on the left shows two draftsmen hand plotting from the digital read-out in mid-run. [GLMWTJ

AIRFRAME TESTINGto what women could do. Around 1962 IBM introduced a Mid-Atlantic regional computing center in Washington, D. C., having one IBM 650 rotating-drum computer. The GLMWT began nightly transfers of boxes of IBM cards there for processing. Most universities acquired their first computing facilities around 1961 through purchase of the IBM 1620. When the University of Maryland installed its first UNI VAC mainframe, the original 1620 was moved to the GLMWT where it served as a dedicated machine for processing tunnel data until replaced by an IBM 1800. In 1976 a HP 10000 was installed for direct, real-time data processing. Today it is augmented by five Silicon Graphics Indigo workstations with Reality Graphics.

None of these advances increased precision or accuracy of tunnel measurements. The primary benefit was greater data-processing efficiency. Ideally one wants real­time data analysis so that one can alter test protocols as things proceed. On-line

computing capabilities provided the same testing economies that telemetry provides in flight test environments. Computer processing also improved control of systematic errors in the data gathering process. For example, the six fundamental measurements are supposed to be independent of each other. But the mechanical linkages often transferred influence from another of the components onto a given beam balance. Various Rube Goldbergs involving screw mechanisms driven by motors to counteract such effects were attempted, but never were that satisfactory. Measurement of and data correction for such contaminating influences proved far more reliable.34

Подпись: Tunnel wall У///Л Less than 0.5% from mean. [ I 0.5 to 1.0% from mean. 1.0 to 1.5% from mean У 1 1.5 to 2.0% from mean.

Unlike normal flying conditions, the wind tunnel test chamber is enclosed and “the longitudinal static pressure gradient usually present in the test section as well as the open or closed jet boundaries in most cases produce extraneous forces that must be subtracted.”35 These lateral boundary effects corrupt virtually every measurement. Corrections are made for “additional effects due to the customary

Figure 21. Wind tunnel test section calibrations typically reveal asymmetric dynamic pressure distributions with variations above acceptable limits. Even more troublesome are problems of excessive angular variation. These are minimized by adjustment of guide vanes, screens, and propeller pitch. Remaining affects are subtracted from the data using calibration curves. [Pope 1947, p. 83.]

Table 1.

(Adapted from Pope 1947, pp. 212-213.)

Boundary effect

Measurements affected

blocking

all forces and moments; pressure distribution

alteration of local angle of attack along the span

spanwise load distributions; start and spread of stall

alteration of normal curvature of the flow about a wing

wing moment coefficient

alteration of normal downwash behind wing

measured drag and angle of attack; tailsetting and static stability, location of wake at the tail

flow alteration

measured control surface hinge moments

alteration of normal flow around an asymmetrically loaded wing

boundary effects become symmetric and observed rolling and yawing

alteration of normal flow behind a propeller

measured thrust

failings of actual wind tunnels – angularity, velocity variations, and turbulence” which are known from calibration of the tunnel itself.36

Wind tunnels such as GLMWT cannot achieve transonic or supersonic wind speeds. Early means for achieving such speeds included attaching scale models to very fast subsonic planes and diving them or dropping instrumented bodies for free – fall from very high altitudes.37 Eventually transonic (Mach 0.7-1.2), supersonic (Mach 1.2-5), and even hypersonic (Mach > 5) wind tunnels were created by a combination of beefing-up the drive system (using multiple propellers or even multistage turbine compressors) and drastically narrowing down the throat to produce a Venturi effect that briefly achieves the desired wind speeds.

The main differences between high speed and low speed tunnels are placement of the model downstream from the narrowest part of the throat; the need to change nozzle shape since a unique nozzle shape is required for each mach number; much higher magnitude of energy losses induced by tunnel walls, models, apparatus, etc.; the need to keep the air free of water vapor and small particles of foreign matter such as dust that disturb supersonic flows; and the need to mount the model on beam balances in a manner that does not use pylons and the like which cause excessive disruption of airflow near the model. This is accomplished by mounting the model from behind with a strain-gauge balance measuring device inserted in the interior of the model. The strain gauges measure torsional and other deflections of the mount.38

Testing the Fan

The fan by itself – i. e., without the turbine blade portion of the bluckets (see Figure 10) – went on test for the first time in September 1957 amid widespread doubts within GE that it would achieve its calculated performance. As Table 1 indicates, it better than merely achieved it. The calculated design point had a pressure-ratio of 1.62 with an adiabatic efficiency of 83 percent at a flow rate of 250 lbs/sec. The measured values were a pressure-ratio of 1.655 and an adiabatic efficiency of 87.2 percent at a flow rate of 257 lbs/sec. Moreover, the off-design performance was excellent – e. g., the highest measured efficiency of 89 percent was at 80 percent speed – and performance was not unduly sensitive to radial and circumferential flow

Table 1. GE’s CJ805-23 Fan Aerodynamic Performance

PRESSURE

RATIO

AIR FLOW (LBS/SEC)

ADIABATIC

EFFICIENCY

DESIGN REQUIREMENT

1.60

250.

82.0

CALCULATED PERFORMANCE

1.62

250.

83.0

MEASURED PERFORMANCE

1.655

257.

87.2

distortions of the sort that would occur during flight. Finally, because “the possibility of adaptation of the aft-fan engine to commercial use was considered fairly early in this program,”66 noise measurements were made to assess how much fan “whine” would offset the gain in total engine noise from reducing the exhaust velocity; the results were not discouraging.

Testing the Fan

Figure 12. Fan blade leading edge flow angles in General Electric CJ805-23 fan engine, [p. ll.]

Figure 13. Rotor relative and absolute inlet Mach number in CJ805-23 fan. Note absolute Mach numbers are well below 1, but Mach number relative to rotor is above 1 everywhere but at the inner radius, making this a transonic stage. [p. 12.]

Testing the FanFigure 14. Rotor relative and absolute outlet Mach number versus radius in CJ805-23 fan. Both relative and absolute outlet Mach numbers are below 1.

[p. 12.]

An obvious question is whether the performance was achieved through the analytical method’s successful prediction of the actual detailed flow. The answer is yes and no. In general, the actual blade-element performance did not depart radically from prediction. Only the tip showed a large departure from prediction, most likely because tip-clearance vorticity effects unloaded it. Nevertheless, there were clear discrepancies between prediction and measurement. Figure 12 shows that the rotor leading edge flow angles were around 2 degrees off calculation, probably due to the leading edge configuration that had been dictated by mechanical considerations. Similar discrepancies were found in other parameters. Figures 13 and 14, for example, show the predicted and measured radial variation of the rotor inlet and outlet Mach numbers, respectively, at design speed. The measured blade loadings, specified in terms of the diffusion factor and the static pressure-rise coefficient, are compared with the design values in Figure 15. The actual loadings were generally a little lower than the design values, though the comparatively close agreement in the case of the diffusion factor should be noted. Correspondingly, the actual inlet Mach numbers were around 0.05 higher than predicted over much of the blade. In short, the analytical method did not predict the actual flow to high accuracy. Yet it did provide sufficient control for design purposes.

The aerodynamic design of this fan was a milestone in the history of axial compressor design. As we indicated earlier, the compressor stages that were then in flight were limited by Mach number considerations to pressure-ratios in the range of 1.15 to 1.20. NACA’s 5-stage transonic compressor had achieved an average

Testing the FanFigure 15. Fan rotor blade loading parameters versus radius for CJ805-23 fan. Note close agreement between design and measured values of diffusion factor and less good agreement in values of pressure rise coefficient, [p. 12.]

pressure-ratio around 1.35 per stage, but this was an experimental design, exploring the boundaries of the state of the art, not something ready to be installed in an engine, and a 1.35 stage pressure-ratio is far below the 1.655 achieved by Wright’s fan. Higher pressure-ratios than this had been obtained in some of NACA’s experi­mental supersonic stages, but these too were far removed from designs that could be incorporated into engines. Generally, the experimental supersonic stages had had much lower efficiencies, the principal exception being Klapproth’s 1400 ft/sec design, which involved only a rotor, not a complete stage. The GE fan was more than just the last and best in the sequence of the NACA designs. As a flight-worthy aerodynamic design in a wholly new stage pressure-ratio regime, it redefined the state of the art. This is not to deny that this transonic fan culminated the NACA supersonic compressor research. As Lin Wright remarked years later, “what the supersonic compressor research program taught us was how to design superior transonic stages.”67

Testing the Engine-A Quantum Jump in Performance The first full engine test of GE’s prototype turbofan engine, then designated the X220, occurred on December 26, 1957, three months after the fan aerodynamic design had been verified. Figure 16 displays the engine. It achieved Blanton’s target of 15,000 pounds of net sea-level-static thrust at a specific fuel consumption below 0.55, and it performed well at off-design conditions. GE had its turbofan engine at remarkably little development cost.

Very quickly a prototype of the CJ805-23 was assembled, and testing to qualify it for commercial flight was initiated. The addition of the aft fan increased the thrust of the CJ805 turbojet by roughly 40 percent, while lowering the specific fuel consumption by as much as 20 percent. The fan added nearly 1000 pounds to the weight of the engine, but, by virtue of achieving the fan performance in a single stage, the thrust-to-weight ratio of the turbofan engine, 4.24, was better than the 4.16 value of the turbojet.68 The best way of appreciating the full

Testing the Fan

Figure 16. General Electric CJ805-23 turbofan engine. [W. Hesse and N. Mumford, Jet Propulsion for Aerospace Applications (New York: Pitman Publishing, 1964), p. 261.]

magnitude of the advance is to compare the CJ805-23, with its 1.56 bypass ratio, to Rolls-Royce’s Conway RCo.10, with its 0.6 bypass ratio. This model of the Conway was specified to produce 17,000 pounds of take-off thrust at an overall specific fuel consumption of 0.70 with a thrust-to-weight ratio of 3.76.69 The CJ805 could produce nearly as much thrust while consuming better than 15 percent less fuel in a 1200 pound lighter engine. The CJ805-23 created a totally new standard for fuel consumption, and hence operational economy, in commercial flight. In a four-engine transport every pound saved in fuel or in engine weight represents added range or four pounds added to payload. Commercial airlines would never again tolerate the old standard – the turbofan had arrived.70

WOODEN AIRPLANE PROGRAMS COMPARED

The American, Canadian and British wooden aircraft programs present striking contrasts in both attitudes and outcomes. Within the technical branches of the national air forces, American personnel displayed clear antipathy towards wooden airplanes, while Canadians expressed varying degrees of enthusiasm, and the British demonstrated more neutral sentiments. The British produced the most successful wooden airplane of the war, and Canadians made significant design innovations, while Americans were unable to produce first-rate airplanes in wood. Americans seemed to find the maintenance peculiarities of wooden airplanes intolerable, while the British and Canadians treated these difficulties as manageable problems.

The technical branches of the U. S. Army Air Forces expressed consistent hostility to wooden airplanes through rearmament and war. This hostility is not apparent from the published record, which was tightly constrained by the needs of wartime propaganda. The archival evidence, however, reveals that the technical branches of Army aviation remained hostile to wood despite the aluminum shortage, and despite the official endorsement of wood construction as a solution to this shortage. There appeared to be no supporters of wooden construction in leadership positions at Wright Field, either among the civilian engineers or the officers. In mid-1942, J. B. Johnson, the Army’s chief expert on aircraft materials, continued his opposition to wooden airplanes, invoking the familiar arguments of poor durability, moisture absorption, and lack of uniformity. A senior engineering officer at Wright Field echoed Johnson’s assessment a few months later, advising a prospective manufacturer of wooden airplanes that “the Army Air Forces prefers all-metal airplanes to those constructed of plywood.”49 Within the Army, support for wooden airplanes came not from Wright Field but from Washington, where the Air Corps was under intense pressure to make at least a show of meeting the President’s massive production goals.50 General Arnold repeatedly pushed Wright Field personnel to buy more wooden airplanes despite their strong objections. Arnold criticized Wright Field’s “apparent procrastination” in promoting the use of wood and plastics in airplanes, and even threatened personnel changes unless the situation improved.51

Maj. General Oliver P. Echols, commander of Wright Field, defended his organization against Arnold’s criticism, insisting that wooden airplane work “has been prosecuted most vigorously.” But top officers at Wright Field showed continued hostility to wood. In December 1942, H. H. Kindelberger of North American Aviation telephoned General К. B. Wolfe, chief of the Production Division at Wright Field, to complain about the wooden fuselages that the Air Corps was requiring for the North American AT-6. Wolfe responded by condemning the entire wooden airplane program, arguing that it would be better to have fewer planes than to buy wood trainers. “We fought, bled and died over this wooden program,” continued Wolfe, “and we were finally sold down the river on it…. So far as I am concerned, I would like to just push a few of these [wooden] jobs out into the training crowd and let them see what they are up against.” Wolfe took the opportunity to complain about other wooden airplanes, and concluded that “we are just making a lot of trouble for ourselves on this wooden program.”52

Among the British, attitudes towards wood were more neutral. Despite extensive technical discussions, British officials rarely engaged in general condemnation or praise of wood in aircraft structures. In the late 1930s, the RAF had converted to metal as thoroughly as the Army Air Corps, at least for combat types. But when the Air Ministry began debating the Mosquito project in late 1939, the main objections were to lack of defensive armament rather than wooden structure. At a high-level meeting of the Air Ministry’s Research and Development staff, for example, the Mosquito’s designers claimed that “the wooden construction was so perfected as to produce a smooth skin and eliminate sources of drag;” none of the government officials questioned this claim. Geoffery de Havilland himself was willing to build airplanes in either wood or metal; he choose wood for the Mosquito to get the design into production quickly, because wood required fewer design details and less complex production tooling. In 1943, de Havilland told the British historian M. M. Postan that “there is nothing to choose between wood and metal construction from the point of view of performance, and the weight of the two materials is also similar.” This neutral attitude was the rule among the technical branches of British aviation, even when dealing with problems related to wood structures.53

Attitudes toward wood were even more favorable in Canada. Canadian authorities voiced considerable enthusiasm for wooden airplanes, an enthusiasm found within the RCAF as well among other government entities concerned with aviation.54 The strongest enthusiasm for wood came from J. H. Parkin at the National Research Council, which performed most of structural testing and research needed by the RCAF. In a report dated May 1940, Parkin proposed a program for developing wooden military airplanes in Canada. Parkin’s memo marshaled the best technical arguments available on the advantages of wood construction, using the analysis developed by wood’s most enthusiastic proponents in the late 1930s. Wood had its supporters within the RCAF as well, among them Air Vice-Mai shall E. W. Stedman, the chief technical officer in the RCAF. In sharp contrast to the American officers at Wright Field, Stedman and other RCAF technical officers strongly supported development and production of wooden airplanes, and cooperated closely with the NRC in the development of the Vidal Anson.55

When it came to designing and building wooden airplanes, American incompetence seems remarkable. British firms had little trouble designing effective wooden airplanes, though there were some failures, such as the Albermarle. In the United States, the C-76 fiasco was apparently the direct result of Curtiss-Wright’s unfamiliarity with wooden airplane design. Curtiss-Wright engineers clearly thought in terms of metal, and had little understanding of how to use wood effectively.56 De Havilland engineers, in contrast, emphasized the importance of their prior experience with the Comet and Albatross airliners, whose wooden structures were similar to that of the Mosquito.57 The Canadian success demonstrated that lack of design experience could be overcome by consistent government support and effective applied research. Despite well-founded British skepticism about the abilities of Canadian designers, the Vidal Anson was the only successful molded plywood airplane produced by the Allies during the war. Even more ironically, the Vidal Anson was based on technology developed in the United States, technology that the U. S. Army and Navy rejected.58

With regard to production, American aircraft firms seemed unable to take effective advantage of woodworking machinery, while woodworking subcontractors had little sense of the exacting standards required in aircraft manufacturing.59 The British, in contrast, had no more trouble achieving quantity production with wooden than with metal aircraft. Canadians showed that the Mosquito was adaptable to assembly-line production, while they had little difficulty finding Canadian firms competent to produce the Anson fuselage with its novel molded construction.60

One finds similar differences with regard to maintenance. Most sources agreed that wooden airplanes suffered more from exposure to the weather than all-metal types, though some argued that higher maintenance costs were balanced by ease of repair. In Britain, durability problems in wooden airplanes received high-level attention from engineers at the Royal Aircraft Establishment. These engineers worked closely with airplane manufacturers to develop modifications to reduce weather-related maintenance problems.61 The Canadians paid particular attention to the durability of molded plywood components, conducting careful exposure tests under harsh Canadian conditions.62 In the United States, in contrast, repair personnel had little patience with the specific maintenance requirements of wood airplanes. In September 1943, the Air Service Command went on record with a memorandum strongly opposing wooden training airplanes, citing their high maintenance costs and a tendency “to disintegrate from time to time.”63 Yet this assessment may have reflected high-level antagonism as much as actual experience with wooden aircraft. A very different picture emerged from a 1944 British mission that gathered “first­hand” information on the durability of wooden airplanes in the United States. The mission reported “no serious difficulties” with the maintenance of wooden aircraft in the United States, despite “less thorough” maintenance procedures and more widely varying climatic conditions than in Britain.64

Flight Test

From its very inception in 1915, NACA understood it “was crucially important… to relate data taken from the testing of models in a wind tunnel to data taken from frill­sized aircraft in flight.”39 NACA stressed on-board flight instrumentation, taking
careful measurements from calibrated instruments. Early instrumentation included altimeter, tachometer, airspeed indicator, and inclinometer*

Use of on-board automatic recording devices began very early. In 1919 both an automatic recording accelerometer and a hargraph recorder were used, and in 1920 a Jenny was equipped with 110 pressure orifices connected to glass-tube manometers with data collected by a camera system.40 Photographing duplicate instruments in the rear cockpit led to more elaborate photopanels – which were

Flight Test

Flight Test

Figure 23. An early version model of the X-2 undergoes tests at the speed of sound in the Langley high speed tunnel (left). To minimize turbulence effects the model is on a rear mount that inserts a strain gauge balance (right) into the model interior that reads out the six fundamental performance dimensions. [Right: NACA as reproduced in Baals and Corliss 1981, p. 38; left: Pope and Goin 1965, Fig. 7:12, p.261.1

Flight Test

standard during the 1940s and 1950s. Test pilot readouts from instruments sometimes were voice-recorded. As early as March, 1944, on-board flight recorders were used in testing a Martin B26-B-21 Marauder41 and Brown strip recorders42 were carried in the 1944-45 tests of the XP-63 Kingcobra. The Bell XS – 1 used oscillographs to record data for its first Air Force flight at Muroc, August 6, 1947, and also had radar tracking and six channel telemetry to transmit airspeed, control surface position, altitude, and acceleration to the ground station.43 Magnetic tape recording began in the late 1940s. In 1953 a complete recording facility was installed at Edwards AFB, and by the early 1960s magnetic recording on-board or at the end of a telemetry link was becoming standard.44

The 1943 NACA P-39 Aircobra tail-failure tests had “instruments to record variables in the indicated airspeed, pressure altitude, normal acceleration, engine manifold pressure, engine rpm, approximate angle of attack of the thrust line and landing-gear position. Other parameters recorded were aileron, elevator, and rudder position, aileron and elevator forces, rolling, yawing, and pitching velocities, and the pressure distribution over extensive areas of the wings and tail surfaces.”45 By 1959 instrumentation for the X-15 had grown to around 750 channels of data, including telemetered biomedical instrumentation of the test pilot, Scott Crossfield, who thought they’d gone overboard and refused to fly wearing “the damned rectal probe” they wanted.46 The total jumped to over 1200 channels for the 1965-1966 flight tests of the XB-70B.

The instrumentation, recording, data reduction, and analysis of airframe data from photopanels and oscillographs is essentially the same as was discussed for engine flight tests, and will not be repeated. Instead, I will focus on the XB-70 which was the first airframe to rely on airborne digital tape recording as primary means for collecting data. Two prototype XB-70s were developed and flown for a total of 129 test flights. One was destroyed in a collision with an F-104 chase plane.

Flight Test

Figure 24. A Bell and Howell gun camera mounted above the DOAK 16 rear cockpit records readings by photographing a duplicate instrument panel shown right. This technique is a forerunner of photopanels. [Briining 1963, p. 95.]

Ц is rumored that development cost $2 billion and that each test flight cost

$800,000 47

The XB-70 had sensors for airspeed, altitude, mach number, acceleration, attitude, attitude rate, temperature, pressure, position, force, stress, quantity, RPM, current, voltage, frequency and events. Sensors were installed throughout the aircraft in close proximity to the physical or electrical stimulation. Two sorts of signals arc collected in flight test: dynamic and quasistatic.4* They vary in frequency and require different recording techniques. For high frequency oscillatory phenomena and flutter, frequency modulated (FM) tape recording is preferred 44 The XB-70 used a 14 track magnetic recorder with conventional EM techniques to

Flight Test

Flight Test

Figure 26. On-board Brown strip recorder used in the XP-63A Kingcobra flight tests. [Young Collection)

Flight Test

Figure 27. Airborne digital tape unit (13) used in flight lest ol the DC-8 aircraft, ca. 1%2. Also shown are power supply (12) and test demodulators (II). [Bosman el al, 1963, p. 22.)

record high frequency (> 20 cps) data and the 36 channels of aircraft performance and condition data that were telemetered to the ground for assessing in-flight performance.50

Most XB-70 data were low frequency and recorded using multiplexed pulse – coded modulation recording. The XB-70A collected 706 and the XB-70B 920 channels of low frequency data, Each data sensor was run through conditioning circuitry, then sampled using a solid-stale subcommutator switch. Sampled output then was filtered before being again sampled on one of 50 master commutator channels. Master commutator output was then put through an analog-lo-digital converter and recorded on a 16 track magnetic tape in pure binary form. Two tape recorders connected sequentially allowed recording of 92 minutes of data. Data were sampled at the rate of 20,000 per second.

Flight Test

Figure 28. North American XB-70 A mach 3 experimental bomber powered by six General Electric J-93 turbine engines having 30,000 lbs thrust each. It measured 189’ long and 30’ high, with a 105’ wingspan – roughly 2/3 of a football field. [ NASA 68-H-191.]

Flight Test

Figure 29. Chart summarizing the data acquisition and reduction during the first 92 hours of XB-70 flight time. [Ince 1967, Fig. 3, p. 199]

There were two recording modes: In automatic mode a 5 second burst of data was recorded in 30 second intervals. In manual mode, the test-pilot would turn continuous recording on and off. These methods of “editing” the recording cut data collected down to 85 million measurements per flight from the potential 1.3 billion.

The data reduction facility had tape units for reading airborne tapes and an on­line computer with an external auxiliary computer that could output data to other tape units compatible with NASA data analysis computers. There was a high speed plotter. Data reduction averaged 2.5 days per flight, with 10 million data points handled per day. Quick-look editing records that compressed data by 75% helped determine data-reduction requirements. Computerized data analysis processed an average of 25 million measurements per flight. Plotting was done with cathode-ray displays.

The XB-70B’s 1200 channels of data with 85 million measurements per flight is a far cry from the 2-3 instruments a test pilot could occasionally read and record on a knee pad. Primary motivation for automating data collection and analysis was reduction of data processing time, not improved accuracy – which remained largely unchanged throughout this period. Ideally one wants results of one test run before commencing the next one. Hand transcribing readings from photopanels or oscillographs and analysis by hand-plotting and mechanical calculators retarded the flight test efficiency. Meanwhile whole crews were kept waiting, which was very expensive.

Flight Test

Figure 30. Flight test is personnel intensive. First-flight picture of the complete crew assigned to the GE F-104 742, 1958. Approximately half worked on instrumentation or data analysis. The pilot, Elliot See, later became an astronaut and died in a T-38 crash. Bill Barnes, son of aviation pioneer Pancho Barnes, is front-row right. The author, who built the modular instrumentation package described in the text, is fourth from the right in the second row. [Suppe collection.]

PRATT & WHITNEY RESPONDS: THE JT3D FRONT FAN ENGINE71

Word leaked to P&W in early 1958 that GE was well along the way toward flight – qualifying an aft fan engine.72 Their initial public response took the same dismissive stance that they had taken in response to the Conway, namely that properly designed turbojets could do anything that bypass engines could do. Privately, they adopted a three-pronged approach. One task force was charged with putting together a case that there was no real future in bypass engines, that at best these engines were just a temporary digression that would disappear with continuing advances in turbojet technology. A second task force developed a paper design of an aft fan engine, as competitive with what was known of GE’s engine as they could. A third task force aimed to build, using mostly existing parts, a front fan engine and to put it into operation on a test stand as quickly as possible.

P&W had shown little prior interest in turbofans. But they were developing a large diameter axial compressor for use in a nuclear powered engine.73 The idea was to use blades from the first couple of stages of this compressor in place of the first two or three stages of the low-pressure compressor of a J-57 or JT3C-6, with the flow in the outer portion of the large blades bypassing the gas generator. Even with restaggering of the large blades, there was little hope of these front stages matching the remaining stages of the low-pressure compressor. Hence no one was thinking that this cobbled together front fan engine would achieve any sort of reasonable performance. But P&W could point to it, saying that they too were developing a fan engine; it would buy them time.

Remarkably, in a mere matter of weeks P&W succeeded in having a self­sustaining front fan engine in operation on a test stand. While this engine itself was otherwise unimpressive, the work that went into it showed P&W how to go about designing a front fan engine, largely within the confines of their already existing technology, that could compete with GE’s aft fan engine. P&W had one crucial advantage: they were already employing two-spool engines. Tip-speed restrictions dictate that a bypass fan operate at a comparatively lower RPM. Thus, in the CJ805- 23, for example, the gas generator rotor operated at 7684 RPM at take-off, while the fan operated at 5727 RPM. In the advanced versions of the J-57 and JT3C that P&W had under development, the high-pressure compressor operated at 9500 RPM, and the low-pressure compressor, at 6500 RPM.74 So, the question became whether P&W could design a fan to replace the front part of the low-pressure compressor that would match the performance of GE’s aft fan. The only alternatives were to come up with an aft fan behind the J-57 or to develop a new gas generator. Both of these alternatives entailed considerable cost and a long delay before they could meet GE’s challenge.

EXPLAINING THE DIFFERENCES

How does one explain these national differences, especially considering the active exchange of technical information between the Allies?65 In part, the differences may have resulted from historical contingencies, such as Britain’s earlier mobilization date, which gave the British aircraft industry more time to develop new wooden airplanes. Perhaps resource endowments were a key factor, given the ability of the United States to expand aluminum capacity rapidly. But the sharp contrast in attitudes towards wood suggests a more systemic cause. Where this contrast was most stark, namely between the United States and Canada, national culture provides the key explanatory resource through its influence on the symbolic meanings of airplane materials.66 In Britain, where these symbolic meanings carried less ideological weight, the effective use of wood depended more on organizational structures, structures that effectively mobilized British technical talent for the war in the air.

Resource endowments fail to provide a sufficient explanation. In terms of price differentials, there is little evidence that the relative costs of aircraft timber and aluminum alloy varied much between the three countries. Military planners, however, were less concerned about relative prices than absolute availability of materials in wartime. The British had little reason to prefer one material or the other, being heavily dependent on imports for both aluminum and timber. Even Canada’s enthusiasm for wood cannot be explained by that country’s vast reserves of virgin timber. Indeed, Canada was a timber-rich country, but so was the United States, while both were equally dependent on imported bauxite. In terms of resource endowments, Canada had one of the most important ingredients for aluminum – hydropower. Although Canada experienced aluminum shortages early in the war, production expanded quickly, and by 1942 Canada had surpassed Germany to become the second largest producer of aluminum in the world. From 1941 through 1944, Britain’s metal aircraft industry was almost entirely dependent on imports of Canadian aluminum, which also supplied a sizable percentage of American consumption. In 1941 alone, Britain imported six times more Canadian aluminum than it produced domestically.67

Historical contingencies also fail to explain the systemic differences in the utilization of wood. British military planners had taken only limited steps to insure adequate wartime supplies of aluminum when the war started in 1939. As soon as the war began, however, they faced clear shortages of aluminum, machine tools, and skilled aircraft workers. These shortages convinced the Air Ministry to support wooden airplane projects like the Mosquito, which was approved in December 1939. In the United States, the extent of the aluminum shortage did not become apparent until late in 1940, in part due to an amazing lack of foresight by defense planners. Only in the spring of 1941 did the Army begin a major program to develop new wooden airplanes; by the time these new models were ready for quantity production, the aluminum shortage was over.68

But on closer examination, these accidents of timing support little explanatory weight. Production deliveries of the Mosquito began a mere 19 months after the project was approved, demonstrating that wooden airplanes could reach production rapidly if given sufficient priority. In addition, increased supplies of aluminum prompted neither the Canadians nor the British to cancel wooden airplanes when those designs fulfilled expectations. Most of the Canadian Anson 5’s and Mosquitos were built between 1943 and 1945, when aluminum supplies were adequate. In the United States, the increased aluminum supply made it easier for Wright Field to justify canceling wooden airplane projects, but most of these projects were already in trouble.69

The failure of the United States to produce any satisfactory new wooden airplanes, and the clear contrast in attitudes towards wood, suggests more systemic causes, most significantly differences in the symbolic meanings of airplane materials rooted in the national culture of each country. These differences are most clear between the United States and Canada. In the United States, the aeronautical community continued to view wood as an unscientific, preindustrial material fundamentally unsuited to aircraft. In Canada, wood benefited strongly from its link to Canadian nationalism. In Britain, however, symbolic meanings generated no strong passions either for or against wood.

As I have argued above, in the United States the development of metal airplanes was driven by the symbolic connection between metal and technological progress. Americans were quite vocal in expressing these symbolic meanings, but not especially more so than the French, Germans or British.70 British engineers were among the first to publicly endorse metal construction after the Armistice, using a rhetoric of technological progress that was repeated in French, German and American publications.71 By 1940, the negative associations of wood appeared to be fading in the United States. From 1940 to 1943, the American aviation press was filled with articles praising the potential contributions of wooden airplanes to the war effort. This public shift was not accepted by Wright Field engineers, however, nor by most of the larger aircraft firms. Wright Field engineers simply could not reconcile the use of wood with their vision of aviation progress, as their private comments so clearly demonstrate.

The Canadians were no less committed to technological progress than the Americans, but in Canada wooden airplanes took on quite a different meaning because of their connection with Canadian nationalism. World War II provided an important stimulus to Canadian nationalism. After the fall of France, anglophone Canada gave whole-hearted support to Britain, but the Canadians insisted on giving this support as an ally, not a colony.72 Within the context of Canadian nationalism, wooden airplanes became a symbol of self-reliance, potentially freeing Canada from the technological domination of the U. S. and Britain.

Wooden airplanes gained this significance after the Dunkirk evacuation, when Britain cut off supplies of airplanes and engines to Canada. One manifestation of this new significance was Parkin’s proposal in May 1940 for the design and production of wooden airplanes in Canada. Parkin’s proposal was followed in July by an even more remarkable document conveyed to the Ministry of Defence by L. W. Brockington, a top advisor to Prime Minister MacKenzie King. This report echoed Parkin’s technical arguments, but added another crucial element – the need for Canadian technological autonomy. The report rejected the “optimistic delusion” that Canada could depend on Britain and the United States for war materiel. Given the current situation, “Canada has now got to stand on her own feet, and utilize the resources she has for her own defence,” namely Canada’s ample timber supplies. In a subsequent report, Brockington proposed creating a Canadian institute to design wooden airplanes with an annual budget of $450,000.73

The idea of Canada as a forest nation has deep roots in Canadian national consciousness. “In Canada, the forest is always with us,” wrote Arthur Lower, a leading Canadian intellectual, in 1963. Canadian pioneers viewed these timber resources as inexhaustible, and the timber industry remains a vital part of the Canadian economy. Despite Canada’s huge aluminum industry, aluminum played no role in Canadian national identity.74 Canadians shared the faith in technological progress that was behind American antipathy to wooden aircraft. But within the context of Canadian nationalism, wooden aircraft became a symbol of national autonomy rather than a slap in the face of progress. It was this official commitment to wood, in sharp contrast to the United States, that allowed Canada to achieve success with the same plywood molding technology that failed in the United States.

While symbolic meanings help explain the divergent histories of the Canadian and American wooden airplane programs, they played a more neutral role in Britain. It is, in fact, rather surprising that the British did not share the American antipathy to wood. Britain provided the prototype of industrialization based on the shift from organic to inorganic materials, a shift that Werner Sombart regarded as the essence of modern industry. The Air Ministry had long justified support for metal construction because of Britain’s lack of suitable supplies of aircraft timber, even though the British aircraft industry at first emphasized domestic steel over aluminum, which required foreign bauxite. Much has been made in recent years of Britain’s supposed lack of “industrial spirit,” but when it came to military aviation, Britain was as militantly technological as any nation, to use David Edgerton’s terminology. In performance, British military aircraft maintained their parity with German equipment, and the British found a much better balance than the Germans between quality and quantity.75 Nevertheless, when World War II arrived, the British aeronautical community quite willingly embraced a material that Americans regarded as hopelessly outdated.

In part, Britain’s lack of antipathy to wooden airplanes may stem from that country’s more ambivalent cultural attitude to the airplane. As Joseph Com has documented, American popular enthusiasm for the airplane was almost boundless, an enthusiasm that was shared by the American aviation community.76 Britain embraced the airplane as fervently as the Americans, but in Britain this enthusiasm was tempered by a strain of pessimism largely absent in the United States. In Britain, the immediacy of the airplane as a military threat helped emphasize the airplane’s military over civilian uses, making it easier to contest the symbolic link between the airplane and progress.77 With this link to progress contested, the wooden airplane did not present such a symbolic clash between tradition and modernity as it did in the United States. Without this symbolic baggage, the British were able to take a much more factual approach to wood, recognizing its utility in wartime, taking advantage of its technical characteristics, and treating maintenance problems as difficulties to be overcome through engineering research. This attitude, aided by the close coordination between the industry and wood researchers in the government, allowed the British to use wood much more successfully than the United States.

The idea that national cultures can influence technological change is common in history of technology, but it should be employed with some caution. A national culture is not a rigid structure that defines the essence of a people, but rather a human invention that is polysemic, contested and mutable. Essentialist notions of national cultures can easily degenerate into ethnic stereotypes. National cultures do shape technological choice, but not in the form of causal structures that rigidly determine human action. Rather, national cultures function more like sets of tools that human agents deploy in various ways to define and solve problems, tools that consist largely of prior symbolic meanings. When creating and adopting a new technology, producers and users also form a new culture for it, a set of meanings and practices associated with the artifact and its use. While the Americans, Canadians and British all shared similar technological tools with regard to wooden airplanes, their symbolic tools differed. The result was variations in both the physical artifacts produced and in the meanings attributed to them.78

1 , London, Aug. 4, 1996.